International Journal of Pharmaceutical and Phytopharmacological Research
ISSN (Print): 2250-1029
ISSN (Online): 2249-6084
|
The Effect of Lepidium Sativum Seeds in Modulating the Hemolytic Effects Induced by Citric Acid in Rats
Maha Jameal Balgoon*, Nada Awadh Aljohani |
|
Department of Biochemistry, Faculty of Science, King Abdulaziz University, Saudi Arabia. |
|
ABSTRACT |
|
In Arabic countries, herbal medicine is one of the most common prophylactic and therapeutic agents in use against many diseases such as obesity and underweight. Lepidium sativum (LS) seeds are used extensively in the folk medicine of many countries. The citric acid (CA) is produced in various amounts by all types of citrus fruits. It is commonly used as a food preservative or additive in Saudi Arabia and the food and beverage industry due to its low toxicity. This research aimed to assess the effects of LS and CA alone and in combination with bodyweight, organ weights, and hematology parameters in rats.This experimental, animal-based study included 36 rats divided into four groups: the control group, the LS group (10g/100g of food), the CA group (5g/100g of food), and the LS plus CA group (10g LS & 5g CA/100g of food). For the non-control groups, CA and/or LS were mixed with the rats’ diets for 6 weeks. As far as we are aware, this is the first study in which CA plus LS seeds were mixed with the diets of rats for this purpose. The data revealed that no statistical differences were found among the food consumption, bodyweight, or kidney weights in all groups, whereas there was a significant increase in the liver weight in the LS and LS plus CA groups and there was a significant increase in heart weights in the LS group.Blood samples were collected for estimating hematology parameters. The CA induced a very high, significant increase in white blood cells (WBCs) and platelets. Conversely, there was a significant reduction in red blood cells (RBCs) and hemoglobin. In conclusion, LS seeds significantly treated the hemolytic effects of CA in rats. Further studies involving rigorous clinical trials to assess the effects of LS and CA on biochemical variables in humans are recommended. |
|
Key Words: Lepidium sativum, citric acid, hematology, body weight, rat. |
INTRODUCTION
For many years, natural products have been used as medicinal agents all over the world [1, 2]. Nature has endowed us a great diversity of medically useful plants [3]. Over the past several decades, the use of herbal medicine prophylactic and therapeutic agents against many diseases have continually increased. Medicinal plants are widely used in Saudi Arabia, and this is mainly based on spiritual healing for the treatment of certain disorders [4]. During food processing, natural or synthetic food additives like citric acid (CA) are added [5]; some have bioactive effects.
CA (CA; E330, 2-hydroxy-1, 2, 3-propane tricarboxylic acid, C6H8O7) is an organic compound naturally found in citrus fruits, produced by fermentation. CA is a food preservative; thus, it used in the food industry. It is an important substance that is used in medicines, pharmaceuticals, flavoring extracts, food additives, candies, and soft drinks. CA is a common metabolite in animals and plants [6]. Although its widespread use, some dangers have been noted following exposure to it, embed hepatic fibrosis and necrosis [7], dental cell harm [8], increased chromosomal aberrations [9], and micronucleus in erythrocytes frequency increases [10].
Lepidium sativum (LS [family Brassicaceae]) has been widely used in different parts of the world for its numerous therapeutic applications. The authors of several recent studies have described the traditional uses of LS seed extract in the regulation of many medical problems [11]. LS is a popular herb used in many countries like India, some African countries, and Saudi Arabia [12]. The seeds have many properties including those that are depurative, thermogenic, tonic, rubefacient, abortive, ophthalmic, ophthalmic, aphrodisiac, diuretic, and/or contraceptive [13]. It is essential to note that seeds must be used at the recommended therapeutic doses and for the appropriate duration since they contain substances with well-known toxicities at high doses, although there is no consensus on what is considered safe.
This research aimed to assess the good effects of LS and CA – alone and in combination with each other – on the body, organs weights, and hematology parameters in rats.
MATERIALS AND METHOD
Chemicals
In this study, all chemicals used were of analytical grade. The seeds of LS (Al-ghasiumi) were purchased from the local traditional market in Jeddah, Saudi Arabia. The chemical contents of these seeds were described by Bafeel and Ali [14], as shown in Table 1.; methods for preparing them for use in a healthy diet were described by Adam [15]. The chemical contents of CA (Table 2) and their diets were prepared according to the Miyake [16] method.
A complete blood count (CBC) was obtained using a hemodialyzer(Sysmex) and hemoglobin (Hb) was obtained using a colorimetric method. Chloral hydrate was purchased from SIGMA-ALDRICH, Germany.
Preparation of the experimental diets
To prepare the experimental diets, ground LS seeds and/or CA were mixed with regular rat food. In the first group, the ratio was 10% LS seedsweight/100g of the food; in the second group, it was 5% CA weight/100g of the food. The third preparation consisted of both (10% LS seeds weight/100g of the food and 5% CA weight/100g of the food). Then, a small amount of water was added to the mixture and it was kneaded into a paste. Finally, the paste was shaped into pellets and left to air dry. After drying completely, the pellets were stored at room temperature in clean boxes. Food for each type of diet was prepared fresh every three days.
Experimental animals
Thirty-six male rats were obtained from King Abdulaziz animal house (Jeddah, Saudi Arabia). They were eight weeks old and as a group, had a mean body weight of 216.56 ± 10.84g. The animals randomly divided into four groups (N = 9 for each group) and housed in plastic cages (three rats in each) in an air-conditioned room (temperature 28 ± 2o C) which was kept on a 12-hour/12-hour dark-light cycle. The animals were acclimated for one week before the experiment. During this time the rats had to get to food and water adlibitum. The diet was obtained in pellet form from Grains Silos and Flour Mills Organization (Jeddah, Saudi Arabia). This diet contained 19.91% protein,8.44% moisture, 59.55% soluble carbohydrate,3.42% fiber, 5.59% ash, and 3.09% fat (Table 3). The experimental diets were given for six weeks. Body weights for the ratsand food consumption were measureddaily.
Experimental design
Ethical approval of this experimental study was obtained from the biomedical research ethics committee at the Faculty of Medicine, King Abdulaziz University, Jeddah, Saudi Arabia (Reference NO 122-20). The 36 rats were divided into four groups of nine rats each: The first group included the control (C group) rats which were given an ordinary diet. Rats in the second group (LS group) were given a diet containing (10g LS/100g of food [15]). Rats in the third group (CA group) were given a diet containing (5g CA/100g of food [16]). Rats in the fourth group (LS plus CA group) were given a diet containing 5g CA + 10g LS/100g of food. The body weight of each rat was measured daily. Rats, at the end of the experiment (6 weeks), were fasted overnight then blood samples were taken by syringe from the abdominal artery. Blood was collected in EDTA tubes for complete blood count (CBC) testing. Immediately after collecting the blood samples, rats were sacrificed under anesthesia with diethyl ether by cervical dislocation. Livers, kidneys, and hearts were rapidly dissected out, washed with normal saline for each organ, and weighed.
Table 1: Nutrient compositions of Lepidium sativum
|
Contents |
Lepidium sativum (AL-ghasiumi) % |
||||||||||||||
|
|
The chemical compositions of LS seed were determined by (Bafeel and Ali [14])
Table 2: Nutrient compositions of Citric Acid
|
Contents |
% |
||||||||||
|
|
Hematological studies
Red blood cells (RBCs), White blood cells (WBCs), and platelets (PLTs) were calculated in a hemocytometer. Hemoglobin (Hb) was applied by the colorimetric method.
Table 3: Nutrient compositions of control diet.
|
Contents |
% |
||||||||||||||||||||||||||||||||||||
|
|
(From, Grain Silos and Flour Mills organization, Jeddah). The control diet was analyzed by AOAC [17].
Calculation of the mean weekly body weight and weekly body weight gain
To calculate weekly the mean body weight for each group, the mean daily weights were calculated for the rats in each group. Subsequently, the mean daily weights for the days of each week were summed and this sum was divided by the number of days per week to give weekly the mean body weight for each group. This was done for each week of the experimental period. The mean weekly body weight gain for each group was calculated by subtracting the mean weekly body weight gain for each week from the week before it. The total mean weekly body weight gain was determined as the difference in the mean weekly body weight gain between the last and first weeks.
Statistical analysis
By using Microsoft Office Excel (2016), statistical analysis was performed. The variability degree of the results was expressed as mean ± standard deviation (Mean ± SD). The significance of the difference between samples was determined using one-way ANOVA. The difference was regarded as significant when P<0.05, and non-significant when P > 0.05, where P was the value for comparing between groups.
RESULTS
This study was performed to determine the changes in body, liver, kidney, and heart weights; feed intake; and complete blood counts in rats when LS, CA, and the combination of LS plus CA were added to their diets.
Effects of LS, CA, and LS plus CA on rat’sfood consumption
There were no significant differences between the mean weekly was recorded in the food consumption between C, LS, CA, and LS plus CA groups during the experimental period, as determined by the use of a one-way ANOVA test (Table 4).
Effects of LS, CA, and LS plus CA on body, liver, kidney, and heart weights
There were no significant differences among the means were recorded in either the body weights or the kidney weights among groups at the end of the experimental period. The liver and heart weights were significantly higher (P < 0.05) in the LS group compared with other groups (Tables 5 and 6).
Table 4: Effect of LS, CA and LS plus CA on food consumption (g/rat/day) of rats.
|
Duration of feeding |
C group |
LS group |
CA group |
LS plus CA group |
|
Week 1 |
12.15 ± 0.88 |
13.16 ±0.88 |
11.02 ± 0.45 |
11.18 ± 0.45 |
|
Week 2 |
16.74 ± 0.45 |
17.43 ± 0.23 |
16.33 ± 0.07 |
20.97 ± 0.10 |
|
Week 3 |
17.93 ± 0.19 |
20.67 ± 0.64 |
19.54 ± 0.29 |
14.84 ± 0.39 |
|
Week 4 |
23.21 ± 0.46 |
25.49 ± 1.61 |
25.93 ± 0.64 |
22.73 ± 4.44 |
|
Week 5 |
25.59 ± 0.31 |
28.76 ± 1.99 |
30.22 ± 2.87 |
27.53 ± 1.20 |
|
Week 6 |
21.12 ± 2.47 |
23.69 ± 0.95 |
24.00 ± 2.50 |
17.29 ± 1.84 |
Values are as mean ± SD. The comparison was made using the One Way ANOVA test Significant at (P < 0.05). No significant difference was found between control and other groups.
Table 5: Effect of LS, CA and LS plus CA on body weights (g/rat/week)
|
Week |
Group |
Minimum |
Maximum |
Mean |
± SD |
P-value |
|
1 |
C |
233 |
271 |
255.45 |
11.84 |
0.94 |
|
|
LS |
228 |
287 |
253.34 |
18.21 |
|
|
|
CA |
234 |
261 |
252.89 |
8.55 |
|
|
|
LS plus CA |
234 |
263 |
251.67 |
14.08 |
|
|
2 |
C |
268 |
310 |
292 |
15.02 |
0.50 |
|
|
LS |
268 |
333 |
293.89 |
19.26 |
|
|
|
CA |
278 |
332 |
299.67 |
16.70 |
|
|
|
LS plus CA |
256 |
327 |
286.33 |
22.10 |
|
|
3 |
C |
284 |
330 |
311.78 |
18.84 |
0.32 |
|
|
LS |
286 |
341 |
311.34 |
18.97 |
|
|
|
CA |
288 |
366 |
320.78 |
23.06 |
|
|
|
LS plus CA |
268 |
346 |
299.56 |
23.82 |
|
|
4 |
C |
269 |
365 |
330.34 |
21.50 |
0.28 |
|
|
LS |
304 |
364 |
328.45 |
18.82 |
|
|
|
CA |
301 |
378 |
329.45 |
22.85 |
|
|
|
LS plus CA |
282 |
347 |
311.56 |
28.88 |
|
|
5 |
C |
326 |
393 |
354.89 |
21.00 |
0.22 |
|
|
LS |
317 |
394 |
349.67 |
24.45 |
|
|
|
CA |
325 |
410 |
349.33 |
25.99 |
|
|
|
LS plus CA |
295 |
392 |
330.11 |
33.09 |
|
|
6 |
C |
310 |
395 |
346.78 |
26.56 |
0.70 |
|
|
LS |
329 |
400 |
353.45 |
27.46 |
|
|
|
CA |
307 |
415 |
349.11 |
30.10 |
|
|
|
LS plus CA |
304 |
400 |
337.56 |
32.28 |
|
Values are as mean ± SD. A comparison was made using the One Way ANOVA test Significant at (P < 0.05). No significant difference was found between control and other groups.
Table 6: Effect of LS, CA and LS plus CAon liver, kidney and heart weight.
|
Parameters |
C group |
LS group |
CA group |
LS plus CA group |
|
Liver weight (g) |
8.56 ± 2.81 |
11.92 ± 0.99 |
9.33 ± 0.93 |
10.84 ± 1.01 |
|
Significance |
|
P# = 0.001 P## = 0.002 |
|
P# = 0.005 |
|
Kidney weight (g) |
2.04 ± 0.17 |
2.25 ± 0.12 |
2.12 ± 0.24 |
2.22 ± 0.25 |
|
Significance |
|
NS |
NS |
NS |
|
Heart weight (g) |
1.11 ± 0.12 |
1.36 ± 0.22 |
1.19 ± 0.13 |
1.13 ± 0.09 |
|
Significance |
|
P# = 0.001 P## < 0.05 P#### = 0.003 |
|
|
Values are as mean ± SD. A comparison was made using the One Way ANOVA test Significant at (P < 0.05). NS: no significant; P#: p-value of comparison versus control; P##: p-value of comparison versus CA group; P###: p-value of comparison versus LS group; P####: p-value of comparison versus LS plus CA group.
Effects of LS, CA, and LS plus CA on hematological results
At the end of the experiment, hematological examinations were conducted for all groups. The effects of LS, CA, and LS plus CAon WBCs, RBCs, Hb, and PLTs in rats were analyzed, as presented in summary form in (Table 7) and as illustrated in Figures 1, 2, 3, and 4. WBCs and PLTs were significantly higher in the CA group compared to the other groups. On the other hand, there was a very low significance in RBCs and Hb in the CA group compared to the other groups.
Table 7: Effect of LS, CA, and LS plus CA on hematology results.
|
Parameters |
C group |
LS group |
CA group |
LS + CA group |
|
WBCc (103/µL) |
5.95 ± 1.41 |
6.57 ±1.15 |
11.80 ± 2.52 |
7.09 ± 1.56 |
|
Significance |
|
|
P# < 0.0001 P### < 0.0001 P#### < 0.0001 |
|
|
RBCs (106/µL) |
6.45 ± 1.02 |
6.55 ±0.79 |
4.98 ± 1.24 |
6.17 ± 1.10 |
|
Significance |
|
|
P# = 0.005 P### = 0.003 P#### = 0.02 |
|
|
Hb (g/dl) |
13.55 ± 1.11 |
13.48 ±0.92 |
10.37 ± 1.44 |
13.22 ± 1.10 |
|
Significance |
|
|
P# < 0.0001 P### < 0.0001 P#### < 0.0001 |
|
|
PLTs (103/µL) |
0.42 ± 0.15 |
0.56 ±0.18 |
0.86 ± 0.14 |
0.53 ± 0.10 |
|
Significance |
|
|
P# < 0.0001 P### = 0.0001 P#### < 0.0001 |
|
Values are as mean ± SD. A comparison was made using the One Way ANOVA test Significant at (P < 0.05). P#: p-value of comparison versus control; P##: p-value of comparison versus CA group; P###: p-value of comparison versus LS group; P####: p-value of comparison versus LS plus CA group.
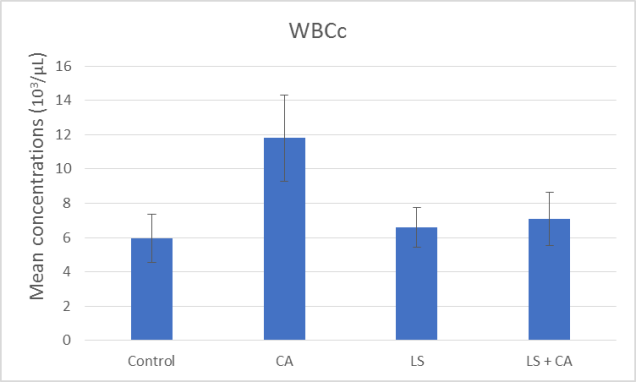
Figure 1: Effect of LS, CA, and LS plus CAon WBCs.
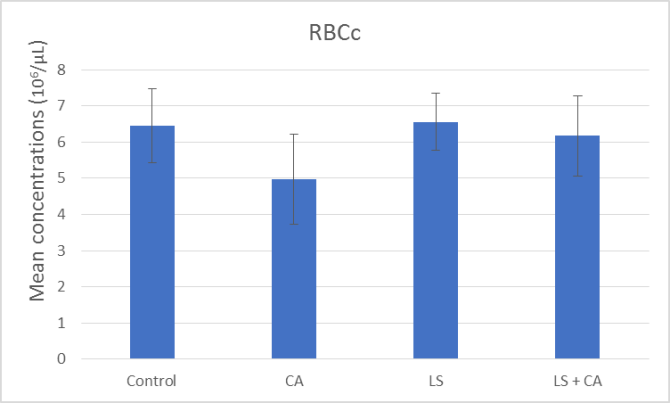
Figure 2: Effect of LS, CA, and LS plus CA on RBCs.
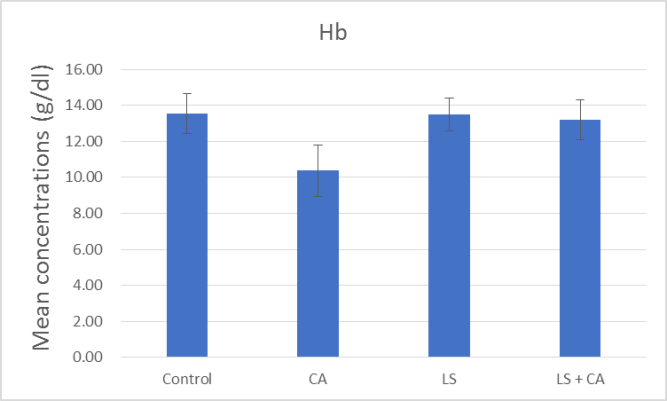
Figure 3: Effect of LS, CA, and LS plus CA on hemoglobin.
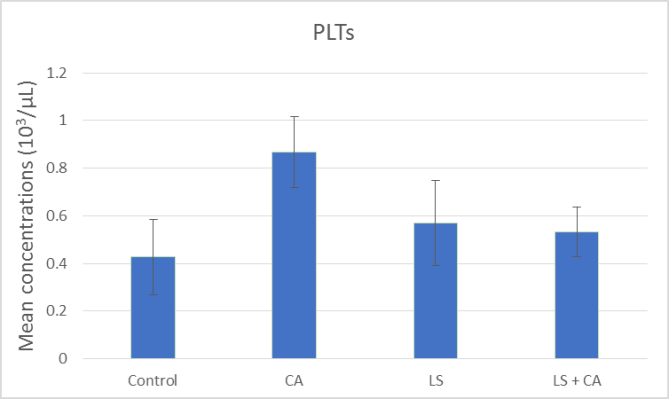
Figure 4: Effect of LS, CA, and LS plus CA on platelets.
DISCUSSION
Many studies have established the predictive power of CA as a food additive and that of LS, each on their own and in combination as herbal medicine. The phenolic, flavonoid and carotenoid contents of LS seeds encouraged us to test their effects to appreciate the effects of LS alone and in combination with CA. Published studies on the effects of LS seeds and CA alone and in combination with one another on weight and weight gains in laboratory animals and humans are uncommon. The current study was designed to assess the good effects of each on food consumption, body weight, organ weights, and hematology parameters in rats for six weeks. Comparisons were made between the results of this study and those of other studies conducted to assess the effects of LS seeds and CA on animals. Not all the parameters studied here were investigated by other researchers. Furthermore, this is the first study to use an LS and CA combination mixed with the diet of rats. We decided to use whole seeds instead of separate active ingredients of the seeds and CA since natural foods contain many different constituents that may or may not be active individually. The broader goal was to consider the effects noted in this study because the ingredients are used by people in their homes. This is the first study to use LS, CA, and LS plus CA in determining effects on the body, organ weights, and hematology parameters.
There were no significant differences between the mean weekly in the food consumption among the groups during the experimental period (Table 4). Moreover, our findings agree with those of Datta et al., who reported that food consumption did not differ significantly among their control group and their experimental groups who were fed diets containing 1%, 2.5%, 5%, and 10% of LS for 90 days [18]. Leaders of other research Qusti et al. found that administration of 20% LS seeds methanol extract to diabetic rats for 28 days led to no significant difference in food intake [19]. Compatibly, our findings agree with those of Al-Hamedan, who administered LS water extract at a dose of 20 mg/kg and LS seeds mixed with a control diet and 5% and 10% LS to hypercholesterolemic rats. They noted that after eight weeks, there were no significant effects on the amount of food eaten by healthy versus hypercholesterolemic control rats [20].
Similarly, our findings agree with the findings of Bagal et al. who reported that food intake did not differ significantly among their control group and groups whose food was supplemented with an organic acid (0.5% and 1%) for 45 days when administered in broiler chicken [21]. One the other hand, our findings are different from those of Halaby et al., who indicated that food consumption differed significantly between their normal control group and their positive control group that was fed a basal diet and given a Cisplatin injection. The also noted changes in their LS supplemented curative groups (5% and 10% of LS) when administered to rats with kidney failure [22]. Likewise, in 1999 Adam reported that rat food ingestion differed significantly among control and LS supplemented groups (10% and 50%) for 6 weeks [15].
At the end of the experimental period, as for body weight, there were no important differences among any of the groups (Table 5). Our results confirm previous findings in that LS has not been shown to significantly affect body weight Mahassni and Khudauardi [23]; Datta et al., [18]. Moreover, in 2011 Kumar et al. reported no significant differences in weight gain among buffaloes in control and LS groups that were supplemented with 50g, 100g, and 150g for 5 months [24]. Our findings also differ from those of Shawle et al., who noted increased body weight gains of broiler chickens that consumed a diet containing 0.75% and 1.5% LS seeds for 42 days, in comparison to those of the control. LS is known to have a high content of essential fatty acids (linolenic, 29.3% & Oleic, 30.6%) and a high fat percent (18% to 24%; LS seeds are known to increase weight gain) [25].
Similarly, our findings are different from those of Bafeel and Ali who noted decreased body weights of rats that consumed a water suspension of LS containing 4 g/100 ml and 8 g/100 ml for 42 days, compared to rats in a control group. The decrease in body weight may be due to linolenic fatty acids when LS seeds were given in high doses: Conjugated linolenic acid supplementation helps the ratio of lean body mass to fat, which decreases the abdomen in particular and enhances muscle growth [14].
Additionally, in contrast to our results, in 2005 Eddouks et al. found that oral administration of water with LS extract given to normal rats for 15 days caused a decrease in body weight. The reduction could be related to the decrease in food intake [25]. Our findings agree with those of Esmaeilipour et al. who found that the body weights of broiler chickens given 20g/kg of CA did not differ from those of the control group after 24 days. The reason for lack of response or the negative response to CA in some studies is unknown. Therefore, one reason for the absence of a positive response to the incorporate of CA may be due to enough available protein in the wheat-based diets in the present study from 10 days of age until the end of experiment [26]. Also, the findings of this study are consistent with the findings of Abd-Elhakim et al., who found no significant differences in body weights among rats in the control and CA groups that consumed water containing 180mg/kg of CA for 90 days [5].
Our findings are also in line with those of Takatera et al. who found no significant differences in the body weights of rats in a control group versus anemic rats that consumed a ferric iron solution with 1% of CA for 20 days [27]. In this study, there was no change in body weight observed in the CA group that could be related to clinical observations in the experimental rats, revealing quick movements and aggressive behaviors within the first week after administration of CA [28]. In contrast to our findings, the authors of a previous study Aktaç et al., found significantly decreased body weights in mice that were injected intraperitoneally (480 mg/kg of body weight) with CA for 10 days, compared to those in the control group [7].
Our findings are consistent with those of Bagal et al., who reported that body weight gain did not differ significantly among broiler chickens in a control group and those given an organic acid supplement (0.5%) for 45 days [21].
In this study, the weekly contributions of the food additives recorded during the experiment revealed adequate statistical evidence concerning the response of different organs of the specimens. Rats treated with LS (10g/100g of food) showed significantly increased liver and heart weights as compared to other groups, while there was no significant difference in kidney weights among groups (Tables 6). Instead, in contrast to our findings, in a previous study, Mahassni and Khudauardi reported that liver weights did not differ significantly between rats in a control group and rats treated with LS [23]. Our findings also differ from those of Datta et al. who stated they found no significant differences in the liver and heart weights among rats in a control group and rats in experimental groups that were fed LS 0.5%, 1%, 2.5%, or 5% for 90 days [18].
The various biological responses of LS seeds in the above-cited studies may be because of differences in the ways of administration, the suspension of seeds and/or extracts, and the short-term feeding of high doses of LS seeds as compared to the doses used in this study. Therefore, the changes observed in organ weights due to the administration of LS and CA may not be of toxicological importance as isothiocyanates are useful compounds present in the Cruciferae family. These are potent inducers of phase II detoxification enzymes involved in the metabolism of xenobiotics and chemical carcinogens [18]. Also, Shawle et al., reported no effect on the liver and heart weights of broiler chickens that consumed a diet containing 0.75%, 1.5%, and 2.25% LS seeds for 42 days, in comparison to those of the control group [29].
In 1979 Bone reported that abnormalities in the weights of the internal organs arise because of the increased metabolic rate of the organs to reduce anti-nutritional factors to non-toxic metabolites or toxic elements. Thus, the absence of a treatment effect on these organs implies that the test diets did not contain the appreciable levels of toxins used in our study to impair the development of the organs [30]. Our findings are different from those of Hassan et al., who found the addition of LS 0.5%, 1%, and 1.5% to the diets of broiler chickens significantly decreased their heart weights for 5 weeks in comparison to those of the control group [31].
Furthermore, these findings are in line with those of Aktaç et al., who noted a non-significant difference in liver and kidney weights of rats in the control group compared to those of the CA group that was injected intraperitoneally (480 mg/kg of body weight) with CA for 10 days [7]. Other researchers indicated that the inclusion of 20g/kg and 40g/kg of CA did not introduce significant differences in liver weights of broiler chickens between a control group and a CA group for 24 days [26]. Alternatively, our findings are different from those of Takatera et al. who found decreased heart weights in anemic rats that consumed a ferric iron solution with 1% of CA for 20 days, when compared to those of the control [27].
In this study, rats in the LS plus CA group (5g CA + 10g LS/100g diet) had liver weights that were significantly higher than those of the control group; the liver weights of rats treated with LS were of the highest value, with significance. This is because of mixing LS and CA into the diet of rats in the group.
The input of both LS and CA food composition resulted in significant variations in the hematological parameters in the experimental outcome. Rats subjected to CA had significant reductions in RBCs and Hb while there were significant increases in WBCs and platelets (Table 7) and as illustrated in Figures 1, 2, 3, and 4. In agreement with previous research Abd-Elhakim et al., they reported a significant decrease in Hb values, suggesting the induction of anemic conditions. They also found a significant increase in WBCs in rats that consumed water containing 180mg/kg of CA for 90 days compared to those of rats in the control group. The significant increase in WBCs could reflective of an inflammatory reaction [5].
On the other hand, these findings disagree with those of Takatera et al., who found increased Hb values in anemic rats that consumed a ferric iron solution with 1% of CA for 20 days compared to those of the control. The effect of CA on ferric iron absorption may be due to enhanced nonheme iron absorption and improved anemia by chelating and stabilizing ferric iron in vivo [27]. Other researchers found that this significantly increased the blood Hb and had no effects on RBCs or WBCs of Juvenile Beluga (Huso huso) specimens that consumed a diet of 3% CA for 8 weeks. So, the increase in Hb levels in the groups fed diets containing CA might due to be the effect of the maximum liberation of Ca, P, Fe, and Cu from the phytic acid complex by the action of CA [32]. These findings are different from those of Abd-Elhakim et al. who reported significantly decreased platelets and no effect on the mean value of RBCs in rats that consumed water containing 180mg/kg of CA for 90 days compared to those in a control group. Thrombocytopenia was evident in CA-treated rats, which could be linked to the observed splenomegaly in this study [5]. However, WBCs play an important role in health status, and under the same conditions, with a dietary imbalance, WBC counts will be increased [33].
In conclusion, exposure to LS (10g/100g of food) and CA (5g/100g of food) every day for 6 weeks of limited weight gain and food consumption in rats. It also induced changes in organ weights and hematology parameters. Also, the administration of LS seeds significantly treated the hemolytic effects of CA in rats. The varied biological responses of LS and CA in the above-cited studies could be due to the differences in doses and routes of administration. Further studies are recommended, via rigorous clinical trials, to determine the effects of LS and CA activity on biochemical variables in humans.
REFERENCES