International Journal of Pharmaceutical and Phytopharmacological Research
ISSN (Print): 2250-1029
ISSN (Online): 2249-6084
|
Saxagliptin and Metformin Estimation in Tablet Formulation
Bharat G. Murarka 1, Debarshi Kar Mahapatra 2, Sandhya M. Bagde 2, Ujwala N. Mahajan 1, Ajay G. Pise 1* |
|
1 Department of Quality Assurance, Dadasaheb Balpande College of Pharmacy, Nagpur 440037, Maharashtra, India. 2 Department of Pharmaceutical Chemistry, Dadasaheb Balpande College of Pharmacy, Nagpur 440037, Maharashtra, India. |
|
ABSTRACT |
|
A simple, precise, accurate, economical, and selective RP-HPLC method was designed for the simultaneous estimation of saxagliptin and metformin in tablet formulation. A Grace C18 (250 × 4.6 mm i.d., particle size 5 μm) column with water (pH 3.0 adjusted by orthophosphoric acid) and methanol (65:35 ratio) was utilized as the mobile phase employing flow rate of 0.8 mL/min and their concurrent detection at 218 nm. The retention time of saxagliptin and metformin was found to be 7.7167 and 4.7833 minutes, respectively. The system suitability parameters were studied and the method was further validated for linearity, accuracy, precision, robustness (by altering the flow rate; wavelength; and mobile phase composition), limit of detection (LOD), and limit of quantification (LOQ). The method was identified to be linear; highly accurate with a recovery of ~100%; precise with % RSD values less than 2%; and highly robust with no much variability in the retention time. The LOD for saxagliptin and metformin was scrutinized to be 0.08 μg/mL and 5.96 μg/mL; and LOQ were found to be 8.24 μg/mL and 18.06 μg/mL, respectively. A conclusion that the method has a perspective to be used for the daily routine analysis of formulations in pharmaceutical industries could be made. |
|
Key Words: Saxagliptin; metformin; RP-HPLC; simultaneous; estimation; validation. |
INTRODUCTION
Diabetes Mellitus (DM) is a chronic metabolic disorder of carbohydrate, fat, and protein metabolism characterized by high blood sugar as the cells do not properly use insulin [1-3]. At present, nearly 400 million people across the globe are affected by diabetes type-II and are predicted to affect 600 million by the end of 2030 [4-6]. Since a few years ago, a great pace in the development of hypoglycemic formulations and other advancements is taking place [7]. Of them, the combination of saxagliptin (SAX) (Figure 1a) and metformin (MET) (Figure 1b) is an emerging formulation for treating post-prandial conditions in type-II diabetes. SAX, the DPP-4 inhibitor, chemically known as (1S,3S,5S)-2-[(2S)-2-amino-2-(3-hydroxytricyclo[3.3.1.1]dec-1yl)acetyl]-2-azabicyclo[3.1.0]hexane-3-carbonitrile, is a white to light yellow, non-hygroscopic, crystalline powder [8]. SAX works by regulating the levels of insulin that the body produces after eating. MET or 3-(diaminomethylidene)-1,1-dimethylguanidine, is an oral diabetes medicine that helps control blood sugar levels. It acts by increasing the sensitivity of liver, muscle, fat, and other tissues to the uptake and effects of insulin. MET and SAX combination is used to enhance the blood sugar control in adults with type-2 diabetes mellitus [9].
Although, formulation development remained the central aspect in the translation process from lab to market, the analysis of the formulation to ensure the quality characteristic represents the most imperative feature. Therefore, to provide the highest degree of analysis, the development of a simple, specific, sensitive, precise, and accurate method for the routine analysis of drug signifies an essential aspect. On the other hand, an important issue that affects the quality analysis is the cost.
In recent years, the literature has revealed that many analytical methods are specified for the determination of SAX and MET as the individual and combined dosage form. Numerous RP-HPLC methods have been described which have utilized diverse mobile phases, particularly buffer systems like phosphate buffer and potassium dihydrogen phosphate (KH2PO4) along with organic solvents. Some of the reports include methanol with phosphate buffer at pH 2.7 utilizing gradient mode [10]; phosphate buffer (pH 5.0), phosphate buffer (pH 6.8), and acetonitrile in a ratio of 94:6 [11]; KH2PO4, acetonitrile, and methanol in the ratio of 50:25:25 at pH 4.3 [12]; buffer with methanol in a ratio of 55:45 [13]; KH2PO4 buffer (pH 4.5), methanol, and acetonitrile in the ratio of 60:20:20 [14]; phosphate buffer and acetonitrile in the ratio of 60:40 [15]; KH2PO4 (pH 6.8) and methanol in a ratio of 50:50 [16], KH2PO4 (pH 5.0) with dilute orthophosphoric acid, acetonitrile, and methanol in the ratio of 25:50:25 [17], orthophosphoric acid, methanol, and acetonitrile in the ratio of 70:10:20 [18], etc. Additionally, acetonitrile, and methanol in the ratio of 75:15:10 [19]; acetonitrile and methanol with 0.1% OPA in the ratio of 95:5 [20]; etc. are the working ratios employed for the elution.
But, most of the methods are complex for the analytical utility and are not very economic for the daily routine analysis of the formulations. In various situations, routine analysis has restricted their application and every so often leads to the replacement with economic, non-standardized, and non-accurate methods, which affects the quality of the product. The water-based analytical mobile phase systems in combination with the organic solvents are the most preferred choice among the analysts worldwide, where water contributes more than 50% of the system. Based on the demand of analysts in pharmaceutical industries for their routine analysis, a method was designed utilizing the water-based mobile phase system for the simultaneous estimation of SAX and MET where a ratio of 65:35 (water: methanol) was employed.
MATERIALS AND METHODS
Chemicals
The working standard of SAX and MET hydrochloride was obtained as a generous gift from Reliable’s Shree Industrial Training Centre (RSITC), Jalgaon, India. Orthophosphoric acid (OPA) was procured from Avantor Performance Material India Ltd., Thane, India. HPLC grade water and methanol were bought from Merck Specialities Pvt. Ltd,. Mumbai, India. The miscellaneous other chemicals for the analysis were of high grade from Merck Chemicals Ltd., India. Kombiglyze-XR (Bristol Myers Squibb Pvt. Ltd.) tablet containing SAX and MET was purchased from the local area.
Instruments
The HPLC system involved Youngline Acme 9000 isocratic system with UV730D absorbance detector running on autochro-3000 software equipped with reverse phase Grace C18 column (250 mm × 4.6 mm; 5µm) having an SP930D pump at ambient temperature. The UV-Vis analysis was carried out using a double-beam Shimadzu Ultraviolet-Visible Spectrophotometer (Kyoto, Japan) model UV-1800 equipped with a pair of 1-cm path length quartz cells. The weighing was carried out by Shimadzu balance (Kyoto, Japan) model AUW220D. The pH was measured using the VSI® digital pH meter of model VSI-1B. Sonication was carried out by using a sonicator of the Transonic Digital S model.
Detection of wavelength
UV absorption of 10 µg/mL solution of SAX and MET HCl in methanol was generated and absorbance was taken in the range of 200-400 nm. The λmax of SAX and MET HCl in methanol was found to be 214 nm and 234 nm, respectively. The wavelength for the simultaneous analysis was chosen to be 218 nm.
Preparation of standard stock solution
SAX standard stock solution (Stock-IA)
An accurately-weighed quantity, 10 mg of SAX was dissolved in methanol in a 10-mL volumetric flask and the volume was made up to 10 mL to produce a solution of 1000 μg/mL.
MET standard stock solution (Stock-IIA)
Similar to the above solution, 10 mg of MET HCl was dissolved in methanol in 10 mL volumetric flask and the volume made up to 10 mL to produce a solution of 1000 μg/mL.
Preparation of standard stock combination solution (Stock-IIIA)
Working standard of 5 mg SAX and 500 mg MET HCl were accurately weighed and transferred into a 100-mL volumetric flask. Methanol as the diluents was added to make up the volume to 50 µg/mL and 5000 µg/mL. The content was further sonicated for 15 min to dissolve the solute and remove the unwanted gas. Further aliquot portions of SAX and MET HCl stock solution(s) in the ratio of 65:35 were mixed in volumetric flask in 10 mL and volume was adjusted up to mark with mobile phase from the resulting solution. 0.1 mL of the resultant solution was transferred into a 10-mL volumetric flask and the volume was made up to the mark with methanol:water (0.05% OPA).
Preparation of standard solution
Preparation of standard SAX solution (Stock-IB)
From the freshly prepared standard stock solution (50 μg/mL), 0.2 mL stock solution was pipetted out in 10 ml of volumetric flask and the volume was made up to 10 mL with mobile phase to get a final concentration of 1 μg/mL.
Preparation of standard MET HCl solution (Stock-IIB)
From the freshly prepared standard stock solution (5000 μg/mL), 0.2 mL stock solution was pipetted out in a 10-mL volumetric flask and the volume was made up to 10 mL with mobile phase to get the final concentration of 100 μg/mL.
Preparation of standard stock combination solution (Stock-IIIB)
From the freshly prepared standard stock solution (50 µg/mL and 5000μg/mL), 0.1 mL stock solution was pipetted out in a 10-mL volumetric flask and the volume was made up to 10 mL with mobile phase to get the final concentration of 1 μg/ml and 100 μg/mL. The content was further sonicated for 15 min to dissolve the solute.
Selection of mobile phase
A number of trials were performed for the selection of the most appropriate mobile phase. The mobile phase was selected on the basis of the degree of separation, theoretical plate, peak symmetry, and peak purity index. The standard solution that contains a mixture of SAX and MET HCl was run with different solvents and also, a combination of solvents was used to get good separation and stable peak. From the various mobile phases tried, the mobile phase containing methanol and water (0.05% OPA) with pH adjusted at 3.0 was selected since it gave sharp, well-resolved peaks with symmetry within the limits and significant reproducible retention time for SAX and MET HCl combination. The mobile phase was degassed using a vacuum and filtered through a 0.45-µm membrane filter. The mobile phase was allowed to balance until a steady baseline was obtained.
Validation of the proposed method
Linearity and range
The linearity of the proposed chromatographic method was estimated by taking six concentrations; 25%, 50%, 75%, 100%, 125%, and 150% of the target analyte. All the solutions were prepared in methanol and equivalent volumes of each solution were injected under the chromatographic condition. The calibration graph was plotted against the average area and concentration of standard drugs and the regression coefficient value (r2) was determined [21].
Accuracy
The accuracy represents the closeness between the standard reference and the observed value during chromatographic analysis. The accuracy was determined as % recovery of the standard sample spiked to the previously analyzed test sample. Based on the actual and estimated concentrations by spiking equivalent drug substance in placebo at three different concentrations (50%, 100%, and 150%) of the standard drug, the recovery was calculated. Accuracy may often be expressed as percent recovery by the assay of known added amounts of analyte and expressed as % recovery ± (% confidence interval) with % relative error [22].
Precision
The precision of a chromatographic method represents the proximity of repetitive results obtained from the analysis of the homogeneous sample. Precision was verified through the estimation of the inter-day and intra-day variability and expressed in the relative standard deviation (RSD) values. The former study, an intra-day analysis was performed by estimating three concentrations (50%, 75%, and 150%) of the standard solution of drugs six times in a single day whereas, the latter half, inter-day is studied by employing the similar protocol and recorded on three different days [23].
Robustness
The robustness of the analytical method is a process whereby its capacity does not change by small but deliberate variation in method parameters and indicates its reliability when using it regularly. The robustness of a method is evaluated by intentionally varying the chromatographic parameters such as pH, ionic strength, temperature, etc. Here, the robustness of the system was evaluated by studying the effect of deliberate changes caused by altering the flow rate by ±0.1 mL/min (at 0.7 mL and 0.9 mL); wavelength by +1 nm (at 217 nm and 219 nm); and mobile phase composition (at 66 mL MeOH / 34 mL H2O and 64 mL MeOH / 36 mL H2O) while keeping the other chromatographic conditions constant [24].
System suitability parameters
The system suitability parameters represent the essential component of an analytical method, which validates the competence and reproducibility of the chromatographic system. The study involved injecting the standard solution of drug five repetitive times and parameters like peak area, retention time, tailing factor, and theoretical plates of the peaks were calculated [25].
Limit of detection and quantification
Limit of detection (LOD) may be defined as the lowest concentration that can be detected by the method but not always necessary to quantify in exact value [26].
The limit of detection (LOD) was determined by the formula:
LOD = 3.3 (σ / S)
Where, σ ═ standard deviation of response; S = slope of the calibration curve. The slope S may be estimated from the calibration curve of the analyte.
Limit of quantification (LOQ) is the lowest concentration that can possibly be quantified dependably with a particular level of accuracy and precision [27].
The limit of quantification (LOQ) is determined by the formula:
LOQ = 10 (σ / S)
Where, σ ═ standard deviation of response; S = slope of the calibration curve. The slope S may be estimated from the calibration curve of the analyte.
RESULTS AND DISCUSSION
Method development and optimization of chromatographic conditions
According to the previously reported RP-HPLC simultaneous estimation methods, the new method was designed. From the literature, it was suggested that a reverse phase C18 stationary phase having attributes of 250 × 4.6 mm i.d., particle size 5 μm is used. Therefore, the Grace C18 column was used for the enhancement of chromatographic separation technique. The composition of the mobile phase had to be thoroughly learned in order to come up with a method that can achieve a practical scale of multiple drug separation. The selection of mobile phase was made on the basis of the number of theoretical plates, peak symmetry, and peak purity index; after a number of trials using binary eluant systems like methanol, phosphate buffer, acetonitrile, water, etc. pH was suitably altered in the range of 3.0-6.0 to ensure and gain desirable separation. Additionally, a low pH creates an environment that prevents peak tailing and improves the ruggedness of the method. The pH was skillfully altered within 2 units of the pKa to cause unionization of the analyte. A pH higher than 2 units higher on the pKa, often results in ionization of the analyte. Sometimes, what brings out the complete dissolution of the silica from the reverse phase columns is the selection of a basic pH. Furthermore, there is a change that both drugs get degrade in high basic surroundings. The elution with acetonitrile: buffer KH2PO4 (50:50) presented low intensity and high tailing (Figure 2a). Similarly, the concentration ratio of 10:90 resulted in fronting issues (Figure 2b). The buffer was replaced with water because satisfactory results were not obtained. However, when the used along with acetonitrile at a ratio of 20:80, no sharp peak was detected and found as a misfit for elution purpose (Figure 2c). When the amount of water was reduced to 70% along with acetonitrile and followed by a further reduction of 65%, a little betterment was observed. In the former trial, little tailing was seen (Figure 2d), and in the later half, no sharp peak was detected, which was desirable (Figure 2e). When acetonitrile was replaced by methanol for elution in the ratio of 35:65, it leads to a sharp peak, least tailing, and good theoretical plate (Figure 2f). The elution was performed using Grace C18 column maintained at ambient temperature with mobile phase methanol:water (with 0.5% OPA) (35:65) optimized in isocratic mode at a flow-rate of 0.8 mL/min in 10 min run-time, keeping detector at 218 nm. The retention time of SAX and MET was found to be 7.7167 and 4.7833 minutes, respectively (Figure 3). As compared to other methods, where the retention time(s) are either short (2-3 min) or long (8.5-9.5 min), this method has an optimum retention time of less than 8 min.
Method validation
Linearity and range
An excellent linearity was observed over the range of 100-500 μg/mL for MET and 1-5 μg/mL in the case of SAX (Table 1). The linear regression equation and regression coefficient value of MET was found to be y = 13.31x + 98.70 (r2 = 0.998) (Figure 4a) and 210.1x – 10.51 (r2 = 0.997) (Figure 4b) for SAX, respectively, which correspond to highly acceptable degree of linearity.
Accuracy
The recovery data for the accuracy of studies was measured through the calibration curve in which the slope and Y-intercept of the graph play an imperative role in the estimation of % recovery. The developed method holds % RSD values within the acceptance limit of ±2%, i.e. 1.33, 1.06, and 1.10 at three different concentrations for SAX. For MET, % RSD values of the proposed method lie below the pharmacopeia limits; 0.25, 1.16, and 0.31, which indicates good accuracy of the method. The recovery data are described in Table 2.
Precision
The method was found to be highly precise over the range of 50-150% of the standard drug. The % RSD values were found to be less than 2% in both cases. In intra-day variability, the % RSD was found to be in the range of 0.13–0.57% (Table 3) and in inter-day variability, the % RSD range was 0.23-0.67% (Table 4). This concluded that the variability was found to be minimal and the method is precise enough to determine the drug. The intra-day and inter-day variability or precision data are given in.
Robustness
As the chromatographic conditions were altered intentionally, negligible changes were monitored (Table 5). When the flow rate was changed from 0.8 ml/min to 0.7 ml/min, the observed retention peak at 4.7667 for MET and 7.6667 for SAX get increased to 5.0167 and 7.6833, respectively (Figure 5a). When the flow rate was increased to 0.9 ml/min, the retention time was reduced and noticed at 4.1833 and 6.6000 for SAX, respectively (Figure 5b). The variation of wavelength from 218 nm to 217 nm resulted in a shift of retention time to 4.6500 for MET and 7.0833 for SAX (Figure 5c). Similarly, the swing from the wavelength of 218 nm to 219 nm causes a decrease of retention time to 4.5333 for MET and 6.9500 for SAX (Figure 5d). In the purposeful modification of the mobile phase to 66 mL MeOH and 34 mL H2O, the retention time was transformed to 4.5500 for MET and 6.7667 for SAX (Figure 5e). Likewise, the retention time was adapted to 4.5500 for MET and 6.7667 for SAX, when mobile phase composition was changed to 64 mL MeOH and 36 mL H2O (Figure 5f).
System suitability parameters
The system suitability parameters mentioned that the proposed method has appropriate competence and capability to be utilized for regular analysis. As per the minimum requirements of monographs of United States Pharmacopoeia (USP), the designed method is capable of giving reproducible results. For SAX, the system exhibited a mean of 3240 theoretical plates, which is more than the minimum pharmacopeia limit of 2000, which represents better separation, resolution, and high column efficacy. The average peak area of the system was found to be 4164, about 12.5% of the total chromatogram area, which indicates high reproducibility and column efficacy. The average retention time (Rt) of MET was recognized at 7.6466 min. The tailing factor (TF) of 1.3075 signified good peak symmetry.
Quite similarly, the MET system displayed a mean theoretical plate of 3148, a value greater than the pharmacopeia limit, thereby representing enhanced column efficacy and excellent separation. The MET system expressed an average peak area of 625 (87.5% of the total chromatogram area), which denoted high column efficacy and reproducibility. The retention time (Rt) of MET on average was perceived at 4.7066 min. The tailing factor (TF) of 1.3075 signified good peak symmetry. The tailing factor value of 1 that implies that there is no tailing is investigative of the fact that the asymmetric factor (AF) is also equal to 1, reflecting the shape of an ideal Gaussian peak where both factors are equal in magnitude. On the whole, the conclusion that the designed method has the attributes of robustness, accuracy, reproducibility, precision, and can be used for routine analysis could be made. The system suitability parameters are depicted in Table 6.
Limit of detection and quantification
The limits of detection (LOD) for SAX and MET were found to be 0.08 μg/mL and 5.96 μg/mL, respectively. The limit of quantification (LOQ) or SAX and MET were found to be 8.24 μg/mL and 18.06 μg/mL, respectively. These results indicate that the proposed method has a very good tendency to detect the lowest concentration of both drugs simultaneously from the formulation.
CONCLUSION
The novel developed method utilizing the mobile phase composition of water (pH 3.0) and methanol at a ratio of 65:35 on a Grace C18 column of a configuration of 250 × 4.6 mm i.d., particle size 5 μm, employing the flow rate of 0.8 mL/min, demonstrated an excellent separation of MET and SAX with sharp peaks at 4.7833 and 7.7167 minutes, respectively. As compared to other methods, where the retention time(s) are either short (2-3 min) or long (8.5-9.5 min), this method has an optimum retention time of less than 8 min. With minute alteration in the retention time in the chromatograph, after deliberate changes in the chromatographic systems reflect that the developed method has high reproducibility attributes. It can be concluded that this simple, precise, accurate, economical, and selective RP-HPLC method has a perspective to be utilized for daily routine analysis of formulations in pharmaceutical industries.
Conflıct of ınterest
The authors state that there is no conflict of interest regarding the publication of this article.
REFERENCES
Table 1. Linearity studies of saxagliptin and metformin.
|
Linearity levels |
Saxagliptin |
Metformin |
||
|
|
Concentration (µg/mL) |
Peak area (mV) |
Concentration (µg/mL) |
Peak area (mV) |
|
25% |
1 |
190.34 |
100 |
1336.03 |
|
50% |
2 |
410.79 |
200 |
2826.35 |
|
75% |
3 |
625.82 |
300 |
4155.59 |
|
100% |
4 |
852.55 |
400 |
5473.33 |
|
125% |
5 |
1020.23 |
500 |
6667.69 |
Table 2. Recovery for accuracy studies.
|
Drug |
Level (%) |
Conc. (µg/mL) |
Peak area of standard (mV) |
Amount added (μg/mL) |
Peak area of sample (mV) |
Mean % Recovery |
± SD |
% RSD |
|
SAX |
80% |
2 |
410.79 |
1.6 |
752.21 |
101.5 |
1.33 |
1.31 |
|
|
100% |
2 |
410.79 |
2.0 |
835.33 |
101.0 |
1.06 |
1.07 |
|
|
120% |
2 |
410.79 |
2.4 |
923.0 |
101.6 |
1.10 |
1.10 |
|
MET |
80% |
200 |
2826.36 |
160 |
4881.5 |
99.30 |
0.25 |
0.25 |
|
|
100% |
200 |
2826.36 |
200 |
5421.33 |
99.82 |
1.18 |
1.16 |
|
|
120% |
200 |
2826.36 |
240 |
5991.2 |
101.1 |
0.31 |
0.31 |
Conc., Concentration; SD, standard deviation; RSD, relative standard deviation
Table 3. Precision data of intra-day variability.
|
Drug |
Conc. (µg/mL) |
Peak area of standard (mV) |
Peak area of sample (mV) |
% label claim |
± SD |
%RSD |
|
MET |
200 |
2826.36 |
2821.53 |
101.00 |
16.42 |
0.50 |
|
|
300 |
4155.60 |
4251.06 |
100.00 |
16.27 |
0.30 |
|
|
400 |
5473.33 |
5493.35 |
99.00 |
22.47 |
0.32 |
|
SAX |
2 |
410.80 |
412.16 |
100.01 |
0.88 |
0.13 |
|
|
3 |
625.83 |
615.17 |
101.03 |
3.19 |
0.57 |
|
|
4 |
852.55 |
846.8 |
99.15 |
4.03 |
0.52 |
Conc., Concentration; SD, standard deviation; RSD, relative standard deviation
Table 4. Precision data of inter-day variability.
|
Drug |
Conc. (µg/mL) |
Peak area of standard (mV) |
Peak area of sample (mV) |
% label claim |
± SD |
%RSD |
|
MET |
200 |
2826.36 |
2921.53 |
102.00 |
17.42 |
0.60 |
|
|
300 |
4155.60 |
4351.06 |
101.00 |
17.27 |
0.40 |
|
|
400 |
5473.33 |
5593.35 |
100.08 |
23.47 |
0.42 |
|
SAX |
2 |
410.80 |
422.16 |
101.01 |
0.98 |
0.23 |
|
|
3 |
625.83 |
625.17 |
100.03 |
4.19 |
0.67 |
|
|
4 |
852.55 |
806.8 |
100.15 |
5.03 |
0.62 |
Conc., Concentration; SD, standard deviation; RSD, relative standard deviation
Table 5. Robustness aspects of the proposed method.
|
Parameters |
Saxagliptin |
Metformin |
||||||
|
|
Conc. (µg/mL) |
Mean area (mV) |
± SD |
% RSD |
Conc. (µg/mL) |
Mean area (mV) |
± SD |
% RSD |
|
Flow rate at 0.7 mL |
5 |
951.19 |
15.08 |
1.90 |
500 |
6883.2 |
52.39 |
0.76 |
|
Flow rate at 0.9 mL |
5 |
929.06 |
8.94 |
0.96 |
500 |
7765.8 |
146.6 |
1.89 |
|
Mobile phase composition (66 mL MeOH + 34 mL H2O) |
5 |
1050.29 |
5.36 |
0.51 |
500 |
7298.2 |
19.73 |
0.27 |
|
Mobile phase composition (64 mL MeOH + 36 mL H2O) |
5 |
1037.75 |
14.04 |
1.35 |
500 |
7354.0 |
118.3 |
1.61 |
|
Wavelength at 217 nm |
5 |
1010.89 |
19.93 |
1.97 |
500 |
7759.4 |
133.6 |
1.72 |
|
Wavelength at 219 nm |
5 |
1071.15 |
17.04 |
1.59 |
500 |
6821.7 |
56.29 |
0.83 |
Conc., Concentration; SD, standard deviation; RSD, relative standard deviation
Table 6. Systems suitability parameters.
|
Saxagliptin |
Metformin |
||||||||
|
RT (min) |
Area (mV*s) |
Area (%) |
TP |
TF |
RT (min) |
Area (mV*s) |
Area (%) |
TP |
TF |
|
7.6667 |
4155.60 |
12.52 |
3250.3 |
1.3077 |
4.7667 |
625.82 |
87.48 |
3149.8 |
1.4444 |
|
7.6667 |
4155.60 |
12.52 |
3250.3 |
1.3077 |
4.6665 |
624.88 |
86.50 |
3147.5 |
1.3311 |
|
7.5666 |
4100.00 |
12.00 |
3150.3 |
1.3050 |
4.7667 |
625.82 |
87.48 |
3149.8 |
1.4444 |
|
7.7667 |
4255.60 |
12.99 |
3300.3 |
1.3097 |
4.5667 |
623.44 |
85.22 |
3145.4 |
1.3211 |
|
7.6667 |
4155.60 |
12.52 |
3250.3 |
1.3077 |
4.7667 |
625.82 |
87.48 |
3149.8 |
1.4444 |
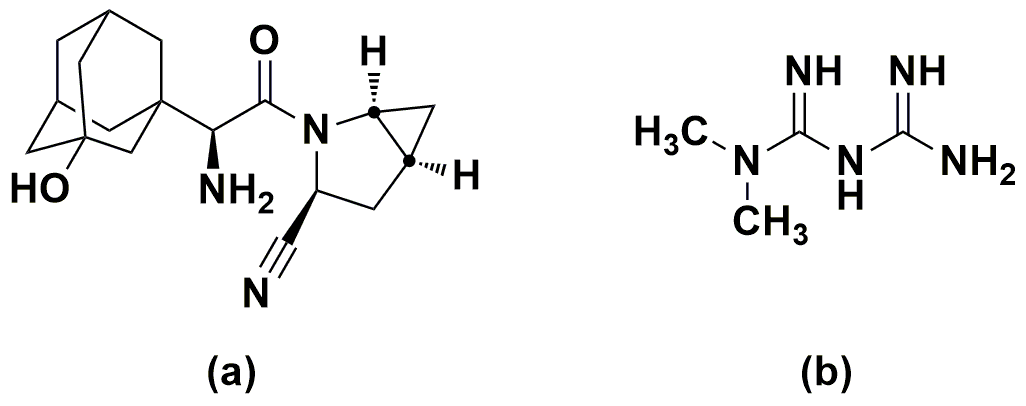
Figure 1. Structure of the drugs: (a) saxagliptin (b) metformin.
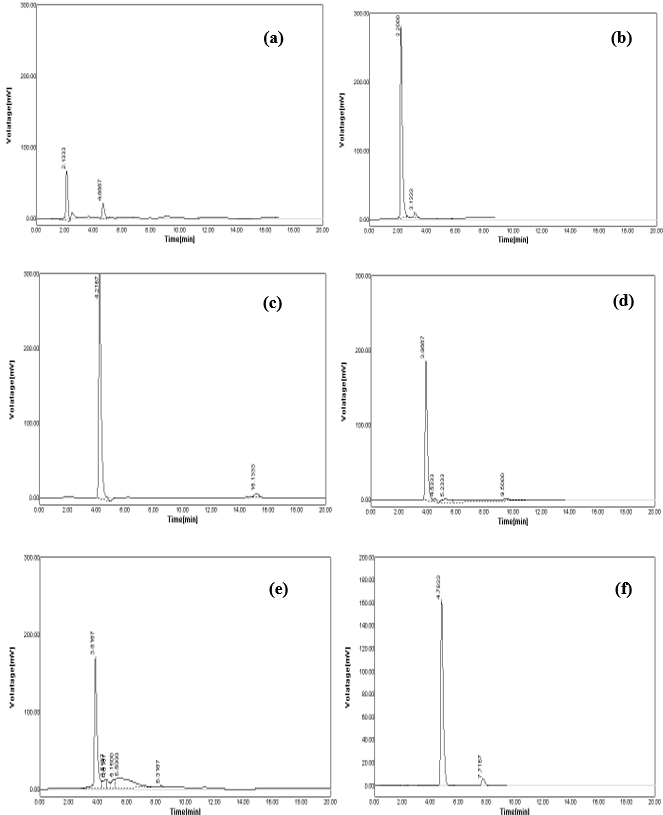
Figure 2. (a) acetonitrile: buffer KH2PO4 (50:50) produces low-intensity and high-tailing peak; (b) acetonitrile: buffer KH2PO4 (10:90) produces fronting peak; (c) acetonitrile: water (20:80) produces no sharp peak; (d) acetonitrile: water (30:70) produces little tailing peak; (e) acetonitrile: water (35:65) produces no sharp peak; (f) methanol: water (35:65) produces sharp and highly resolved peak.
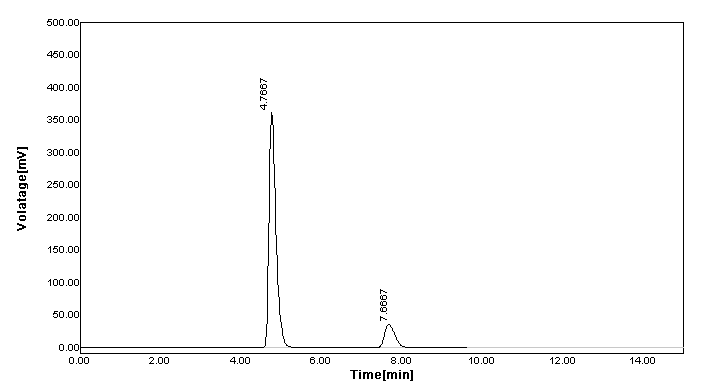
Figure 3. RP-HPLC chromatogram of combination of metformin and saxagliptin.
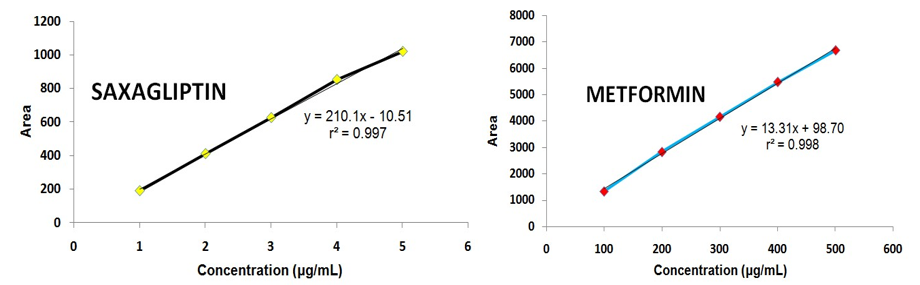
Figure 4. Linearity graph: (a) saxagliptin (b) metformin.
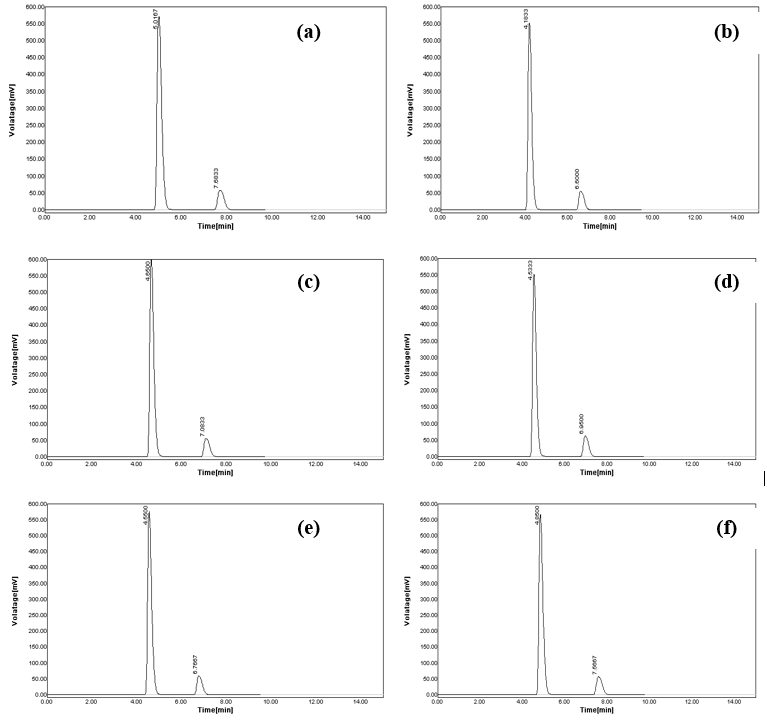
Figure 5. Robustness aspects of the developed chromatographic method; (a) chromatogram recorded at altered flow rate of 0.7 ml/min, (b) chromatogram recorded at an altered flow rate of 0.9 ml/min, (c) chromatogram recorded at an altered wavelength of 217 nm, (d) chromatogram recorded at altered wavelength of 219 nm, (e) chromatogram recorded at altered mobile phase combination (66 mL of MeOH and 34 mL H2O), and (f) chromatogram recorded at altered mobile phase combination (64 mL of MeOH and 36 mL H2O).