International Journal of Pharmaceutical and Phytopharmacological Research
ISSN (Print): 2250-1029
ISSN (Online): 2249-6084
|
Comparison of Changes in Urea and Electrolyte Levels in Saliva and Serum of Patients Before and after Hemodialysis
Ali Taghavi Zenuz1, Farzaneh Pakdel1, Fakhrossadat Mortazavi2, Katayoun Katebi3* |
|
1 Associate Professor of Oral medicine, Department of Oral Medicine, faculty of Dentistry, Tabriz University of Medical Sciences, university street, Tabriz, Iran. 2 Professor of pediatric nephrology, Faculty of medicine, Tabriz university of medical sciences, university street, Tabriz, Iran. 3 Resident of Oral medicine, Department of Oral Medicine, faculty of Dentistry, Tabriz University of Medical Sciences, university street, Tabriz, Iran. |
ABSTRACT
Background: One of the methods for evaluating the efficiency of hemodialysis is measurement of serum urea levels before and after dialysis. Because urea is also secreted in the saliva, finding a relation between serum and salivary urea levels can facilitate this evaluation and decrease the frequency of blood sampling. The purpose of this study was to compare changes in the biochemical parameters in serum and saliva in patients before and after hemodialysis. Methods: In this descriptive-analytic study, 43 consenting patients undergoing hemodialysis who met the inclusion criteria were examined. Venous blood was collected before and after hemodialysis. Whole saliva was collected by spitting into sterile tubes for 5 min before and after hemodialysis. The samples were sent to a laboratory for analysis of urea, creatinine, potassium, calcium and phosphorous. The results were compared and analyzed using SPSS17 and p < 0.05 was considered significant. Results: Serum urea, creatinine, potassium and phosphorous levels decreased significantly after hemodialysis in comparison with pre-dialysis levels (p < 0.001). In saliva urea, creatinine and potassium levels decreased significantly after hemodialysis (p < 0.001), but the decrease in calcium and phosphorous were not significant. A significant positive correlation was found between the serum and salivary urea reduction ratio (r = 0.724). Conclusion: It can be concluded that the urea reduction rate in saliva reflected the urea reduction rate of serum, but there was no significant correlation between changes in other parameters in the saliva and serum; however, more studies are needed to develop a practical use of salivary analysis for evaluating hemodialysis patients.
Key Words: Hemodialysis, Saliva, Urea, Creatinine.
INTRODUCTION
End stage renal disease (ESRD) is an irreversible decrease in the glomerular filtration rate to less than 15 ml/min that results in elevation of serum creatinine and urea levels. Diabetic nephropathy, systemic hypertension and acquired glomerular disease are the most common causes of ESRD [1, 2]. The prevalence of ESRD worldwide is increasing because of the increased prevalence of diabetes mellitus and obesity [3].
Patients with ESRD should undergo dialysis until undergoing a kidney transplant [4]. The common method for evaluating hemodialysis efficiency is to assess the serum urea before and after dialysis, but this requires frequent blood sampling [5]. ESRD patients usually suffer from anemia because of erythropoietin deficiency and each episode of hemodialysis is associated with 4 to 20 ml of blood loss and frequent blood sampling causes more blood loss [6]. Frequent blood sampling has additional disadvantages, such as causing stress and pain, and can increase the transmission rate of blood borne infections (HIV and hepatitis B and C) [7].
The possibility of a substitute for blood analysis which can reflect the biochemical changes of blood pre- and post-dialysis is under debate [8, 9]. Recent studies have proposed saliva as a diagnostic tool [10-13]. Saliva is a fluid derived from serum and contains many of the components of serum [14]. Urea is also secreted in saliva; thus, finding a relationship between blood and salivary urea levels can reduce the need for blood sampling. Also, dialysis is used to regulate potassium, phosphorous and calcium in the blood, and these elements are also secreted in saliva [15]. The advantage of using saliva instead of blood includes its ease of access, non-invasiveness, and repeatability [16].
There have been few studies in the current literature on this subject, and it appears that further studies are necessary to reach an inclusive result. The current study was conducted to compare the differences in the biochemical parameters in serum and saliva before and after hemodialysis in patients undergoing hemodialysis.
METHODS
This descriptive-analytic study was conducted on patients undergoing hemodialysis in dialysis centers affiliated with Tabriz University of Medical Sciences in Tabriz, Iran, in August 2018. All the subjects were at least 18 years of age, and had been undergoing hemodialysis for at least one year. The patients who were not able to cooperate, or did not consent, and the patients with a history of radiotherapy to the head and neck, Sjogren's syndrome or taking medication that could affect the saliva, were excluded. A total of 43 patients entered the study after signing informed consent form. This study was approved by the Ethics Committee of Tabriz University of Medical Sciences with an ethics code of IR.TBZMED.REC.1397.036.
Two milliliters of venous blood was collected from each patient before and after hemodialysis, and the samples were immediately sent to the laboratory to measure urea, creatinine, potassium, phosphorous and calcium levels. For saliva sampling, the recommended method by previous researchers was used [12, 14, 17]. The patients were asked not to eat, drink or smoke for 90 min, and not to brush their teeth for 12 hours prior to sampling. They were asked to lower their heads and not to swallow, but to let the saliva accumulate in the floor of the mouth. Five milliliters of unstimulated whole saliva were collected by spitting into sterile tubes every 30 sec for 5 min before and after hemodialysis. Saliva was centrifuged for 5 min at 4°C at 1000 rpm. Urea, creatinine, phosphorous and calcium levels were measured using an Automatic Analyzer 902 (Hitachi, Tokyo, Japan), and potassium levels were measured by Electrolyte Analyzer (Convergent Technologies, Marburg, Germany).
The data were analyzed by descriptive analysis (mean ± SD). The normality of the data was assessed using the Kolmogorov-Smirnov test. For comparison of the parameters before and after hemodialysis in each fluid, paired T-test was used in case of normal distribution of the data, and a Wilcoxon test was used when the distribution was not normal. The urea reduction ratio (URR) in the blood and saliva was calculated as:
Urea before dialysis – Urea after dialysisUrea before dialysis× 100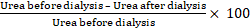 .
.
A linear regression equation was used to estimate serum URR from salivary URR. The results were compared and analyzed in SPSS 17, and p < 0.05 was considered significant.
RESULTS
Of 43 patients, 28 (65.1%) were female, and 15 (34.9%) were male. The average age of patients was 46 ± 19 years (18 to 77 years). The most common causes of ESRD in patients were diabetes mellitus (41%) and hypertension (37%).
The mean serum urea level was 113 ± 27 mg/dl before hemodialysis, and 32 ± 9 mg/dl after hemodialysis. The serum urea, creatinine, potassium and phosphorous levels decreased significantly after hemodialysis (p < 0.001). The calcium level increased in serum after dialysis, but the difference was not significant (Table 1). The mean salivary urea level was 115 ± 35 mg/dl before hemodialysis, and 47 ± 15 mg/dl after hemodialysis. All parameters measured in saliva decreased after dialysis. The decrease in urea, creatinine and potassium levels was significant (p < 0.001), but the decrease in phosphorous and calcium levels was not significant (Table 2).
Table 1. Mean level of biochemical parameters in the serum pre- and post-hemodialysis
|
P-value |
Changes rate (%) Reduction (-) Increase (+) |
after |
before |
parameter |
|
<0.0011 |
-71.68* |
32±9 |
113±27 |
urea mg/dl |
|
>0.0012 |
-60.80* |
3.21±1.49 |
8.19±2.93 |
Creatinine mg/dl |
|
>0.0011 |
-26.6* |
3.53±0.41 |
4.81±0.48 |
Potassium mEq/l |
|
>0.0012 |
-56.15* |
2.21±0.46 |
5.04±1.11 |
phosphorous mg/dl |
|
0.1051 |
+3.09 |
8.99±1.38 |
8.72±0.96 |
calcium mg/dl |
|
* statistically significant 1- paired T test 2- Wilcoxon test |
||||
Table 2. Mean level of biochemical parameters in saliva pre- and post-hemodialysis
|
P-value |
Reduction ratio (%) |
after |
before |
parameter |
|
0.0011> |
59.13* |
47±16 |
115±35 |
urea mg/dl |
|
0.0012> |
48.85* |
0.67±0.42 |
1.31±0.48 |
creatinine mg/dl |
|
0.0012> |
18.36* |
5.29±0.86 |
6.48±1.61 |
Potassium mEq/l |
|
0.1392 |
10.93 |
27.7±16.3 |
31.1±17.8 |
phosphorous mg/dl |
|
0.3982 |
10.55 |
5.68±2.49 |
6.35±5.29 |
Calcium mg/dl |
|
* statistically significant 1- paired T test 2- Wilcoxon test |
||||
Based on the independent T-test, there was no significant difference between mean urea levels of serum and saliva before dialysis (p = 0.818); however, the mean urea reduction ratio (URR) in blood was 71.68%, and in saliva was 59.13%. Correlation analysis was performed to determine a possible association between serum and salivary URR. A significant positive correlation was found between serum and salivary URR (r = 0.724; Figure 1). There was no significant correlation between serum and salivary reduction ratio of other parameters.
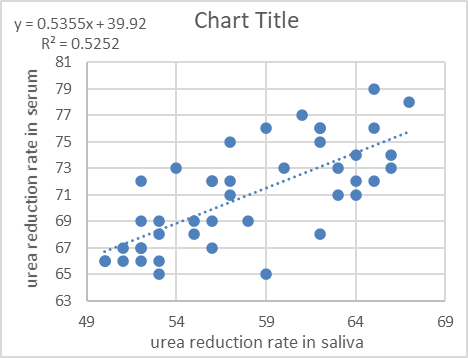
Figure 1. Scatter diagram showing linear correlation between salivary serum and urea levels.
DISCUSSION
ESRD is a life-threatening disease without renal replacement therapy [18]. These patients suffered from systemic uremic complications, and had oral manifestations such as uremic odor, increased dental calculus, taste aberrations and xerostomia [19-21]. Hemodialysis could alleviate these complications, and assist in improvement of oral health.
Whole saliva is an oral fluid secreted from the major and minor salivary glands. Saliva also consists of non-salivary gland origin components including microorganisms, blood cells and desquamated epithelial cells. It also contains substances derived from blood by diffusion from gingival crevicular fluid [22, 23]. Lasisi et al. showed that the levels of salivary creatinine and urea had a positive correlation with levels in the blood in patients with ESRD. This supported the possibility of using saliva in monitoring the patients with ESRD [24].
This study compared biochemical changes in the salivary and serum before and after hemodialysis, and showed that urea levels decreased significantly after dialysis in both serum and saliva. This was in agreement with the results of a study by Cheng et al. and Seethalakshmi et al. who concluded that whenever there is a change in serum urea, the salivary urea changes accordingly, because urea is secreted into the saliva by passive diffusion [9, 25]. In the present study, the mean urea reduction ratio in the blood was 71.68% and, in the saliva, it was 59.13%. This difference could be caused by the delay in achievement of equilibrium between the serum and saliva. Because there was a significant positive correlation between serum and salivary URR, the salivary URR could be used to estimate serum URR.
Creatinine is a large molecule with a high molecular weight, and has little secretion into the saliva in healthy individuals. Renal failure, because of the uremic environment and damaged acinar cells, caused more creatinine to be secreted into the saliva [26]. The results of the current study showed that salivary creatinine levels were high before dialysis, and decreased significantly after dialysis. This finding was consistent with the results of a study by Fregoneze et al. Their results showed that high serum creatinine levels in ESRD patients caused a concentration gradient which facilitated the creatinine diffusion into the saliva [26].
In the current study, calcium levels did not change significantly in either the blood or saliva after dialysis. This was consistent with Khanum et al., who showed that after dialysis, the levels of sodium and calcium did not change [27]. This meant that the serum calcium levels of patients were similar to that of the dialysis solution.
The results of this study showed that blood and salivary phosphorous levels have decreased after hemodialysis. The decrease in phosphorous was significant in the blood, but was not significant in the saliva. This finding was consistent with the results of Seethalakshmi et al. with regard to blood levels, but not for saliva [25]. The current results indicated that the concentration of phosphorous in the saliva was much higher than in the blood. This could be because phosphorous is secreted by passive diffusion as well as active transport in the saliva of ESRD patients [28]. Savica et al. showed that patients undergoing hemodialysis can secrete 300 to 600 mg of phosphorous into the saliva daily; thus, measuring salivary phosphorous levels can be an indicator of the need to initiate hemodialysis [29].
The current study showed that potassium levels in the serum and saliva decreased significantly after dialysis. This finding was consistent with the results of Seethalakshmi et al. [25] and Khanum et al. [27]. Seethalakshmi et al. showed that the decrease in salivary potassium was less significant than the decrease of urea and creatinine [25]. This could be explained by the fact that aldosterone was secreted because of the decrease in extracellular volume after hemodialysis, which activated potassium secretion into the saliva [25].
The present study had some limitations, such as low sample size. More studies with larger sample sizes should be conducted before saliva can be used as a diagnostic tool. Age also may have an effect on salivary composition, but the patients of the current study were from a wide range of ages because of the limited access to hemodialysis patients.
CONCLUSION
This study showed that the salivary urea level before dialysis can be used as a substitute for serum urea, and salivary URR could be used to estimate serum URR. Although creatinine and potassium levels decreased significantly both in serum and saliva after dialysis, there was no correlation between their reduction ratio in serum and saliva. It is too soon to suggest complete substitution of serum analysis with saliva based on these findings.
The authors declared that there was no conflict of interest.
REFERENCES