International Journal of Pharmaceutical and Phytopharmacological Research
ISSN (Print): 2250-1029
ISSN (Online): 2249-6084

Based on the studies, the strategy to design a thermal imaging hardware and software complex to monitor inflammatory processes in animals has been developed. Analysis of temperature indices in various healthy cow body areas has been carried out. The reasons for animal body temperature change during physiological processes caused by developing inflammation foci in the cow mammary gland and weight-bearing joints at subclinical disease period have been considered. Parameters of thermal imaging and associated equipment required to detect temperature abnormalities caused by inflammatory processes have been analyzed. The methods of thermal image segmentation, as well as their traditional histogram analysis and new methods of phase portrait analysis, have been reviewed. The key features of thermal image formation and processing aimed to monitor inflammatory processes in animals are discussed.
INTRODUCTION
In cattle husbandry, the main reasons for the decrease in productivity and cow culling are inflammation in the mammary gland - mastitis, and inflammation in appendicular joints. The most widespread and economically challenging issue is the current form of the disease - subclinical mastitis, which today affects up to 20-30% of the cow population at some farms [1]. The disease is associated with a decreased milk-producing ability by 15-20%, a significant deterioration in the milk quality, increased offspring morbidity rate, and leads to cow rejection. The existing methods to diagnose subclinical mastitis do not enable identifying diseased cows in a short time, to a relatively high degree. The reason is that they are based on milk sample testing, take much time, and are ambiguous due to the multivariable indicator dependence.
Of no less importance is the problem to diagnose joint diseases in cattle, which are most often detected when the animal starts limping. In such cases, milk yield decreases by 20-30%, treatment is long and difficult, and animals are rejected. Today, in milk production farms, up to 30% of livestock suffer from joint and hoof diseases [2].
Searching and developing new time-consuming methods for preclinical mastitis and joint disease diagnosis are of relevance today.
This article aims to develop the basis to create a thermal imaging hardware and software complex to monitor subclinical inflammatory processes in the cow mammary gland and weight-bearing appendicular joints. The complex is required to obtain a preliminary database for early cow mastitis and joint disease diagnosing, and, ultimately, to significantly reduce the impact of these pathologies on the health and productivity of animals, and in some cases, to determine the causes of pathologies.
MATERIALS AND METHODS
In some cases, at farms, inflammation in the cow mammary gland (udder) reaches tens of percent of the milking herds and can be passed to healthy animals in a short time. Analysis of available materials on this issue shows that clinical signs of disease are observed in not more than 5% of animals [3]. Applied methods of quick mastitis and Whiteside testing slightly overstates indicators of subclinical mastitis in lactating cows [4-6]. At the same time, the milk yield decrease varies within 40-60%, and milk losses exceed 5% in the following lactation. Besides, in 30-50% of cases, mammary gland dysfunction in cows is associated with offspring reproductive organ diseases [7, 8].
Studies first conducted by the authors in Russia regarding the use of methods of thermal imaging mastitis diagnosis in cows with simultaneously measured milk conductivity and computed somatic cells [9] showed a fairly high correlation rate and the need for more in-depth development of the mastitis thermal imaging diagnosis method.
The analysis of the inflammatory trend in mammary tissues [10] suggests that the distribution of changes in udder quarter temperature should be measured laterally. The reason for this is that objective assessment of changes in skin temperature in lower mammary gland quarters may be deviated by the udder secretion accumulating here.
Thermal imaging methods have not yet been widely used to diagnose subclinical mastitis due to the lack of developed approaches to measuring inflammatory changes in the udder quarters and the lack of methodology to apply the thermal imaging system, as well as the choice of a method to estimate udder quarter temperature distribution.
The animal musculoskeletal system is often affected due to the functional activity of these organs. Excessive load, fixed range of movement are usually the causes of diseases. The disease incidence in cattle increases with violation of the rules for animal housing and the relevant facility arrangement. The time required for the subclinical form of inflammatory processes in the musculoskeletal system in cows to intensify is often 5-7 days. After that, the disease becomes clinical. At the same time, there is an increase in temperature up to 39-40 Со, as well as a decrease in milk yield and amount of feed consumed. The key symptom common to most limb diseases in the clinical period is lameness.
Mammary gland, reproductive organs, and musculoskeletal system disease incidence in farm cows can exceed half of all cow diseases, and therefore the task to reduce the incidence of these diseases is a matter of great importance in industrial milk production. Developing methods to establish the earliest possible diagnosis will ensure the administration of proper drugs, which will significantly increase the number of cured animals.
RESULTS AND DISCUSSION
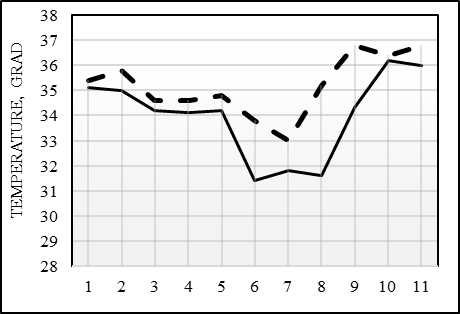
To determine the key parameters of the hardware and software complex, many temperatures and thermal imaging studies were carried out. To determine the effect of cow machine milking on the temperature of the dug base, udder skin temperature measurements in healthy cows were carried out. Milking was carried out by two-stroke milking machines "Majga" during the morning milking. Cow udder temperature measurement was measured with a TPEM-1 electronic thermometer to measure skin temperature. The measurement was taken before and after milking with compliance to the required sanitary treatments. The most instructive was temperature measurements taken near the udder dug base.
Figure 1 shows the results of these measurements for eleven dugs in three cows. A solid line is an udder dug base temperature before milking, a dotted line is an udder dug base temperature after milking. The average dug temperature before milking was 34, 0 °, after milking - 35, 2 °, the standard deviation is 1, 7 ° and 1, 2 °, and the measure of spread was 5% and 3.4%, respectively.
|
|
|
Figure 1. Change in Dug Temperature Before and After Milking |
Statistics of the results obtained make it difficult to draw far-reaching conclusions, but based on the given data, it can already be said that the average dug base temperature is 33-36 degrees during milk production and an increase in temperature above 37° (including an increase achieved by the thermal imaging method) justifies a more thorough check of the corresponding udder quarter. Thus, arranging heat exchange for a living body is a very delicate and complex process, where the general rule is that the temperature always rises in the inflammation focus, particularly at the early stages, when clinical features have not yet formed and do not emerge.
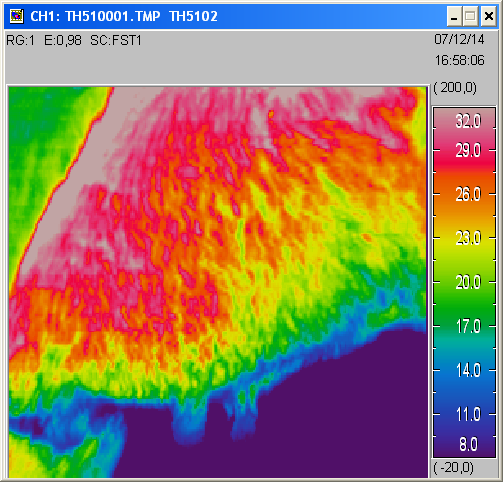
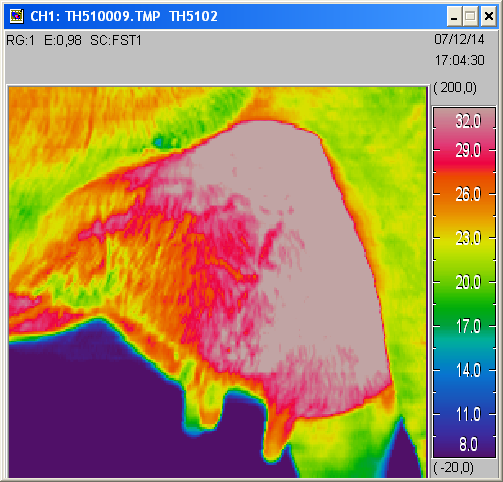
To assess the possibilities to solve the above-mentioned problem with the use of thermal vision, images of the temperature pattern at the cow mammary gland and limb joints were taken [11]. Udder thermal profile samples indefinitely healthy (Figure 2) and diseased (Figure 3) animals are shown below.
|
|
|
Figure 2. Thermal Profile of the Right Mammary Gland in a Healthy Cow |
|
|
|
Figure 3. Thermal Profile of the Left Mammary Gland in a Diseased Cow |
Color gradation comparative analysis of cow udder thermal images showed that the cow's mammary gland has higher temperatures compared to other parts of the body, due to a developed network of blood vessels, arteries, and veins, as well as highly intensive iron physiological processes. A general analysis of the obtained images carried out jointly with the Veterinary Service of the Zolotaya Niva dairy farm, regarding the standard measurement results obtained for electrical conductivity of the selected milk samples and the number of somatic cells there, showed that thermal imaging methods can provide a fundamental opportunity to distinguish not only between the diseased and healthy mammary glands in whole but between its quarters as well.
Analysis of the obtained images shows that temperature histograms (thermograms) of certain animal body areas are effective to select inflammatory areas [12]. However, these areas should be selected with high accuracy to avoid including artifacts in the picture viewed that are not relevant to the inflammatory process. These may, for example, include the areas of udder friction with the cow legs when walking, as can be seen in Figures 2 and 3. The important point here is to select the right angle to get the image and highlight the area which will form the histogram. Another artifact that affects the temperature of various areas, like the area of the udder, can include the ambient temperature depending on the time of year. Regression analysis of thermogram statistical indicators recorded over the year can help to balance these effects. Another option to avoid seasonal temperature shifts may be to obtain temperature histograms separately for each of the four dugs with adjacent mammary gland area in one series of measurements immediately one after another. In this case, the external temperature will likely affect all the dugs in the same way. Having a histogram shift for one of the dugs into the higher temperature region will indicate potential inflammation in this quarter.
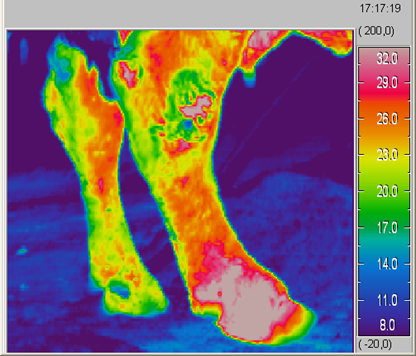
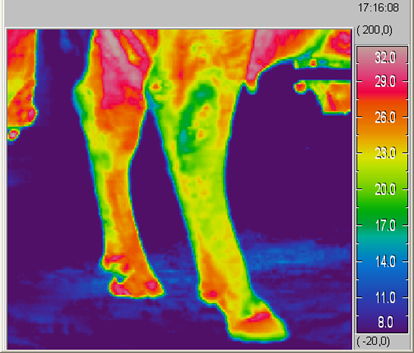
Thermal images of hind limbs in two cows are presented below (Figures 4 and 5).
|
|
|
Figure 4. Thermal Image of Cow Hind Legs with the Right Pronounced Bursitis |
The high temperature in the hoof head of the hind right leg is noticeable (Error! Reference source not found.3). This cow suffers from bursitis and the disease has already developed into a clinical form, which could be diagnosed with no technical means used. However, thermal imaging visualization of such inflammation at the early stage of the disease makes it possible to cure the animal quickly with no complications [13, 14]. In Figure 4, the left leg subclinical condition showing first signs of inflammation can be assumed, there is the reason to study it more thoroughly with the subsequent treatment administered.
Thermal profile analysis of the front limb joints in the studied animals showed that the joint temperature varies from 17 to 29°C, but the maximum temperature of 25-29°C is registered in certain small areas at the points where the knee contacts the stall floor when the animal lies, this artifact should be excluded.
|
|
|
Figure 5. The Hind Legs Thermal Pattern in a Cow with a Projected Subclinical Condition of the Left Leg |
Preliminary studies enable setting and solving the tasks that directly affect the creation of a thermal imaging hardware and software complex to monitor inflammatory processes in animals - to choose thermal imaging and associated equipment, to choose segmentation methods for thermal image histogram analysis. Important issues are also the development of the thermal image histogram analysis and ensuring an approach for safe and effective conditions to the use of a thermal imaging hardware and software complex in the context of large farms.
Selection of thermal imaging and the related equipment
To perform these works, the thermal imaging hardware and software complex is to meet many requirements. As a rule, modern non-special thermal imaging systems work in a long-wave infrared spectral width of 8-14 microns, where maximum Plank radiation falls at ambient temperatures. First of all, it should be noted that the temperature resolution that modern thermal imagers have (not below 0.1°C), including those having bolometric-type photoelectric detectors, is quite enough to solve the problems at hand.
Out of the above presented thermal imaging images, analysis of mammary gland images appears to be the most demanded. Its size is about 50x40 cm2 from different perspectives. At a working distance of about 0.7 m [15], the required view of 40ох32о is achieved. To analyze the obtained image accurately, the minimum-sized segment of a thermal image requires at least 15-20 resolved spatial points. Such a segment is a mammary gland dug, the size of which is ~ 2.5 cm. At a working distance of 0.7 m, angular resolution requirement - no worse than ~ 1.8-2 milliradians- will be established. This resolution set the requirement for a specific choice of infrared optics and the corresponding array of photosensitive elements. The matrix size estimation based on the view angular size provides a 350x280 format for photosensitive elements. Medium-level thermal imaging devices currently have a 320x240 element standard for a bolometric matrix, which is quite suitable to solve the tasks given the possibility of slight working distance adjustment.
As a rule, a modern mid-level thermal imager has a channel of the visible spectrum range which enables taking appropriate photographs and comparing (overlaying) them with similar thermal images. In this way, another stream of additional information is formed associated, for example, with a simultaneous increase in temperature and a change in the shape of the animal's knee.
Finally, the communication interface between a thermal imager and a signal processing system should provide an image signal notation format that is compatible with the requirements for subsequent processing of these signals.
Selecting segmentation methods for thermal image histogram analysis
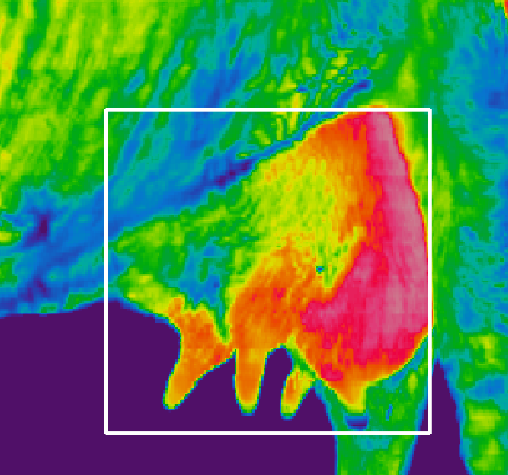
To form thermal image histograms taken from particular body areas of a cow, support for the method to isolate these areas is required. To do this, both manual visual marking of the colored thermal image areas (for example, using a frame) (Figure 6) and automatic segmentation [16, 17] can be used employing local common point or specifically phase portrait histograms considered below.
|
|
|
Figure 6. Manual Segmentation of Areas |
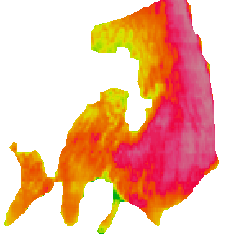
Figure 7 shows a fragment of automatic segmentation obtained by removing pixels from the original thermal image a color set of which on the histogram is below the specified temperature limit.
|
|
|
Figure 7. Automatic Segmentation of Areas |
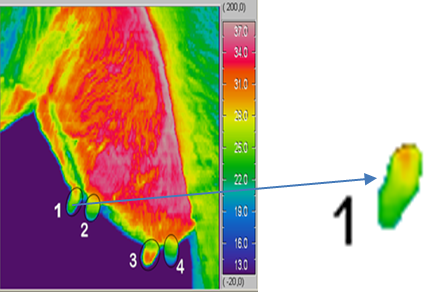
In practice, when specific body areas (udder, joints or muscle groups, and legs of an animal) are to be distinguished, it is advisable to use both methods consistently. An example of these methods combination (interactive segmentation) is shown in Figure 8.
|
|
|
Figure 8. Interactive Segmentation of Areas |
Histogram method development for thermal image analysis
Classical histogram analysis is crucial for halftone (gray) image analysis. Thus, for example, histogram analysis [18] is used to eliminate signal inhomogeneity (geometric noise) in the array of photosensitive elements of a matrix photodetector when forming thermal images with subsequent contrast and brightness adjustment.
A significant drawback of histogram analysis used to describe the spatial structure of the thermal field is its degeneracy to changes in this structure. Because of this, the same temperature histogram may correspond to a large number of different spatial structures observed in the thermal image. Thus, a change in the structure of a thermal image caused by physiological or pathological changes in animal tissues is difficult to detect using traditional histogram analysis, sometimes it is even impossible.
Along with a traditional histogram analysis, a method describing segmented areas (fragments) of semitone (gray) images and basing on the so-called specific phase-portrait image statistics is being developed. Statistics data are specific two-dimensional histograms, Fresnel-based images [19, 20]. Such statistics describe the features of the spatial structure of image peculiarities that are invariant to their translational, scale, and orientation transformations [21].
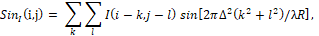
Phase-portrait statistics are generated according to the following model [22]. In this model, it is assumed that the temperature distribution I(i,j) at the selected segment of the halftone thermal image (with discrete coordinates i,j=1,2, …
 ) corresponds to some effective infrared field, the components of which operationally form convolutions I(i,j)
 with two Fresnel windows:
|
|
(1) |
|
|
|
where ∆ – is the distance between pixels (points) of the distribution I(i,j)
 ; λ – is the effective wavelength of the infrared field; R
 – is the distance from the recorded temperature distribution plane I(i,j)
 to the field observation plane.
If distribution I(i,j) is dimensionless (for example, within the dynamic range ADC is 0-256 with its 8-bit encoding), then following (1) the infrared field components SinIi,j
 and CosIi,j
 are dimensionless as well. However, unlike I(i,j)
 , they take both positive and negative values.
Infrared field components in (1) are statistically independent, since the ∆2/λR dimensionless ratio in (1) is selected so that the following condition is fulfilled:
|
|
(2) |
Mathematically, in (1), distribution I(i,j) is decomposed according to the system of orthogonal two-dimensional wavelet functions. Thus, for window sample sizes KxK = 15х15, specifying the regions of data determination for wavelet functions, and the ratio ∆2/λR
 = 0.67857, the infrared field is observed in the near Fresnel zone.
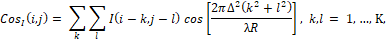
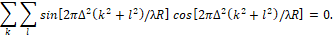
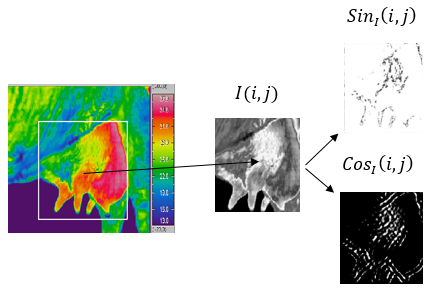
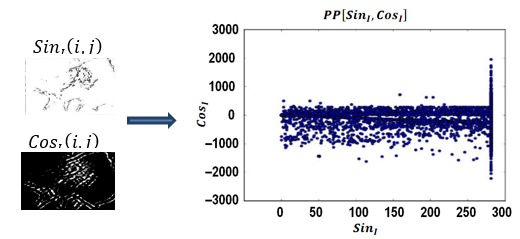
Examples of positive-defined values of infrared field components corresponding to the recorded thermal distribution fragment I(i,j) at KxK = 15x15 samples are given in Figure 9.
|
|
|
Figure 9. Infrared Field Component Generation |
As can be seen from Figure 9, infrared field component generation makes it possible to contrast to the distribution temperature difference regions I(i,j) . The field sinus component highlights the temperature gradient areas, and the cosine component highlights the points areas adjacent to them. Dimensions of these areas are completely determined by KxK dimensions.
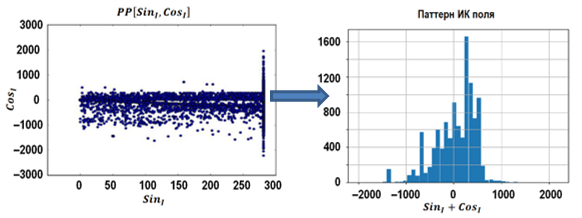
To further describe and analyze the infrared field statistics, its phase portrait is formed PPSinI, CosI– a two-dimensional histogram with components value distribution (Figure 10).
The phase portrait characterizes the statistics of relationships of each distribution pixel I(i,j) with adjacent pixels near the window KxK. The average value of any field statistical characteristic Stat
 and therefore the distribution I(i,j)
 considering its spatial structure, can be obtained as:
|
|
(3) |
where StatSinI, CosI – is a phase portrait reduction operator.
Examples of such statistical field characteristics (patterns) associated with the phase portrait reduction using various "compressive" transformations into a smaller dimension space are discussed in [16, 17]. One of such patterns is the one-dimensional histogram SinI+CosI for field component sum value distribution that is shown in Figure 11.
|
|
|
Figure 10. Infrared Field Phase Portrait |
|
|
|
Figure 11. Infrared Field Pattern |
Application of multivariate data flow patterns to identify their conditions based on the Wald sequential statistical decisions and Bayesian classification is given in [23, 24].
The issue of analyzing thermal images and their "understanding" does not differ from the overall artificial vision problem. Nevertheless, the use of currently developed artificial vision technology for early animal disease diagnosing has certain peculiarities in terms of their thermal images. These peculiarities are related to the nature of the thermal images, to various isolated and considered areas of the animal's body [25-29]. The image composition does not have any distinct forms but is randomly statistical. Therefore, along with the issues of quality of the generated thermal images (their range, accuracy, resolution, capacity), their informative statistical description is crucial, which can later be associated with physiological and pathological signs of health conditions in animals. It should be emphasized that a conventional histogram analysis enables the evaluation of only the number of micro-sites in the observed areas of an animal's body having a particular temperature. However, a histogram analysis does not describe the nature of the mutual distribution of these micro-sites. At the same time, the distribution depends on the physiological and pathological peculiarities of a particular animal, for example, blood flow, vascular arrangement, individual structure features, and lactation period. Therefore, an individual thermal imaging portrait (a set of temperature field characteristic features) is required to be formed for each animal, which can later be automatically connected through an expert system, neural network, or complex intellectual solutions with signs of health status obtained through other methods during veterinary expert assessments. Moreover, such an image is not static but can change over time, for example, with a change in the age of the animal, its various physiological and pathological conditions, and treatment process. In this regard, an approach to improve a traditional thermal image histogram analysis has been developed, which enables its supplementation with individual thermal image creation - temperature field patterns. These are the patterns that will make it possible to move from purely technical and informational thermal vision tasks to monitoring tasks. To achieve this, the required specialized hardware and software based on the solutions discussed above are being developed.
CONCLUSION
Acknowledgments: None
Conflict of interest: None
Financial support: None
Ethics statement: None