International Journal of Pharmaceutical and Phytopharmacological Research
ISSN (Print): 2250-1029
ISSN (Online): 2249-6084
|
The Effects of Vitamin D, Zinc, Calcium, and Magnesium Co-Supplementation on Glycemic Control, Lipid Profile, Liver Enzymes, blood pressure, and C–reactive protein in Type 2 Diabetic Patients |
|
Mostafa Badeli1, Peyvand Mohammadi2, Parvin Ayremlou3, Majid Manafi1* |
|
|
|
1 Department of Nutrition, Faculty of Medicine, Urmia University of Medical Sciences, Urmia, Iran. 2 Endocrinology Sub-specialist, Urmia University of Medical Sciences, Urmia, Iran. 3 Clinical Research Development Unit of Imam Khomeini Hospital, Urmia University of Medical Sciences Urmia, Iran. |
ABSTRACT
Background: The purpose of this study was to evaluate the simultaneous supplementation of vitamin D, zinc, calcium, and magnesium on glycemic control, lipid profiles, liver enzymes, blood pressure, and C-Reactive Protein (CRP) in patients with type 2 diabetes. We assumed that vitamin D, zinc, calcium, and magnesium co-supplementation might improve glycemic control and insulin release.
Methods: The present study was a double-blind, randomized clinical trial conducted on two groups: Intervention group (n = 32) (200 mg vitamin D, 4 mg zinc, 400 mg calcium, and 100 mg magnesium twice daily for eight weeks), and Control group (n = 32) (placebo twice daily for eight weeks). At the beginning and end of the study, the following measurements were evaluated: 3-day 24-hour food recall, blood pressure, anthropometric variables, physical activity, and biochemical tests.
Results: After eight weeks, the intervention group showed a significant decrease in fasting blood glucose (P = 0.001), increase in QUICKI (P = 0.013), decrease in serum cholesterol (P = 0.001), and decrease in GGT enzyme (P = 0.001) compared to the control group.
Conclusion: Concurrent supplementation of vitamin D, zinc, calcium, and magnesium had beneficial effects on the fasting blood sugar, QUICKI, serum cholesterol, and serum GGT in diabetic patients.
|
Key Words: Type 2 diabetes, Vitamin D, Zinc, Glycemic control, Lipid profiles |
Type 2 Diabetes Mellitus (T2DM) is characterized by two distinct features, peripheral insulin resistance and the dysfunction of Langerhans islet beta cells [1-4]. It represents a worldwide epidemic, with significant co-morbidity and mortality due to micro vascular and macro vascular complications [5-8]. According to the International Diabetes Federation, in 2015, 415 million people had type 2 diabetes, with an estimated predicted worldwide prevalence reaching as high as 642 million by 2040 [9, 10]. The growth rate of diabetes in Iran is higher than the global growth rate. In 2015, 4.6 million people had the disease, while in 2040, the figure is predicted to reach 9.2 million [11]. Magnesium, zinc, calcium, and vitamins, including vitamin D, have shown controversial results in improving glucose tolerance disorder [12-17]
Asemi et al. (2016) showed that twelve weeks of supplementation with a combination of vitamin D, calcium, and vitamin K had beneficial effects on glycemic control [18]. Wang et al. (2019) [19] demonstrated that zinc supplementation in diabetic patients decreased fasting blood sugar significantly, while Hu et al. (2019) [20] showed that vitamin D supplementation improved insulin resistance in diabetic patients. Moreover, in Kim et al.’s (2018) study a combination of zinc, magnesium, and chromium supplementation on metabolic syndrome patients showed no significant effect on fasting blood glucose after twenty-four weeks compared to placebo [21].
Given the importance of these elements in insulin release, the concomitant use of these elements is likely to play a more effective role in the management of diabetic patients. Thus, this study was conducted to evaluate the simultaneous effect of vitamin D, zinc, calcium, and magnesium on glycemic control, lipid profiles, liver enzymes, blood pressure, and serum CRP in type 2 diabetic patients. In this context, this paper hypothesizes that the combination of Vitamin D, zinc, calcium, and magnesium could have beneficial effects on glycemic control and insulin release through several mechanisms, including the amplification of glucose homeostasis as well as insulin gene expression.
METHODS:
This study was a randomized, double-blind, placebo-controlled one, and was carried out at Imam Khomeini Hospital, affiliated to Urmia University of Medical Sciences (UMSU), Urmia, Iran, between December 2017 and February 2018. Inclusion criteria included patients with type 2 diabetes aged 18 to 65 not receiving insulin, and who had been diagnosed with the disease for at least one year. According to the criteria of the American Diabetes Association, patients with the following criteria were diagnosed with T2DM: (Fasting Blood Sugar (FBS) ≥126 mg/dl, 2-h postprandial blood glucose ≥200 mg/dl, or glycated hemoglobin (HbA1C) ≥6.5%.) Patients were excluded if they presented with diabetes complications, including cardiovascular disease, kidney disease, and diabetic foot ulcers, smokers, pregnant and lactating women, or those consuming vitamin D, zinc, magnesium, and calcium supplements for the past three months.
Randomization and Masking:
At the beginning of the study, participants were randomly entered using a random number table, then allocated into two treatment groups: supplement group (39 patients (19 females and 20 males)), and placebo group (39 patients (18 females and 21 males)). It should be noted that the incidence and prevalence of diabetes mellitus in men is slightly higher than in women, so both genders were relatively equally enrolled in the study [22].
Experimental (for Research Articles only):
In the two-month study period, the supplement group received 200 mg vitamin D, 4 mg zinc, 100 mg magnesium, and 400 mg calcium in tablet form, while the control group received a placebo. The placebo contained sorbitol carrion and was prepared by Raha Pharma Isfahan Pharmaceutical Factory. Due to the inadequate levels of these elements in diabetic patients, the dose of these elements was determined according to previous studies [18, 21, 23, 24] and based on the RDA of healthy individuals. The instructions for patients were as follows: 1) Fast before blood sampling for at least 12 hours; 2) Consume the supplement or placebo twice daily, once in the morning and once in the afternoon; 3) Do not change physical activity patterns and normal eating habits during the study. The intervention and placebo supplements were in identical boxes, and both researchers and patients were unaware of the contents of the package until the end of the study. Allocation concealment was carried out separately from the patients and investigators by a third person. At the beginning and end of the study, researchers completed a 24-hour, 3-day dietary recall questionnaire by interviewing participants (involving two working days, one day off). Questionnaires were analyzed using Nutritionist IV software, adapted to Iranian dietary patterns.
Also, at the beginning and end of the study, each patient's physical activity was assessed using the International Physical Activity Questionnaire (IPAQ) and was reported as Met-hour / day.
Height, weight, and body composition (WHR, BFM, PFM, BFM, and WHR) were measured with a stadiometer (In body 770, South Korea), scale (In body 770, South Korea), and bioimpedance analyzer (In body 770, South Korea), respectively at the beginning and end of the study, under fasting conditions and in light clothing. BMI was calculated as weight per kg divided by height squared (m2).
Glycemic indices parameters (FBS, serum insulin, HOMA-IR, QUICKI, and HbA1C) were evaluated as primary outcomes. Additionally, lipid profile parameters (HDL, LDL, VLDL, TG), liver enzymes (ALP, ALT, GGT, AST), blood pressure, serum zinc, and C-reactive protein were considered as further primary outcomes.
All blood samples (5 ml) were taken at the beginning and end of the study between 8 am and 10 am, while the patient was fasting and in a sitting position. Then, serum samples were collected and frozen at -80 °C. Serum zinc levels and biochemical parameters were measured with Auto-Analyzer (BT-1500 Hitachi, Japan). Fasting blood glucose, LDL, HDL, Total Cholesterol, TG, liver enzymes (ALT, AST, ALP), and CRP were measured with kits (Dialab, Vienna, Austria) with an inter- and intra-assay CV of <5%, and with a BT-1500 Auto-Analyzer (Hitachi-Korea). The serum concentration of hepatic enzyme GGT was measured using a Dialab commercial kit with a coefficient of variation with an inter-intra assay CV of 3.08-6.22%. Serum insulin concentration was measured with an ELISA kit (Monobind, California, USA) with an inter-intra assay CV of <15%, to 0.25 mU/L lower limits of sensitivity.
Separate blood samples were also taken to measure HbA1C factor with the same blood sampling conditions. They were poured into a separate test tube, and then the whole blood of participants was transferred to the laboratory and measured with kits (Dialab, Vienna, Austria) with an inter- and intra-assay CV of <5%, measured with a BT-1500 Auto-Analyzer (Hitachi-Korea).
QUICKI and HOMA-IR were obtained from the following formulas:
QUICKI = 1/ [log (fasting insulin, μU/ml) + log (fasting glucose, mg/dl)]
HOMA-IR = {[fasting insulin (μU/ml)] × [fasting glucose (mmol/l)]}/22.5
Statistical Analysis:
39 patients were calculated as appropriate group sizes, according to the study of Asemi et al. (2016) [18], taking into account 95% confidence interval and 90% test power (Z1-α/2=1.96, Z1-β= 1.28), and based on the mean and standard deviation of serum insulin (μIU / ml) (20.1±10.5 in the placebo group and 12.7±7.2 in the intervention group).
n=Z1-α/2+Z1-β2(S12+S22)(μ1-μ2)2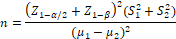
The results were analyzed using SPSS 25 software. At first, the Kolmogorov-Smirnov test was used to distinguish parametric or non-parametric variables. Quantitative variables were reported as mean and standard deviation and qualitative variables as frequency (percent) in the form of appropriate tables and graphs. Chi-square test was used to compare the frequency of qualitative variables between the intervention and placebo groups. Independent T-test was used to compare the means of quantitative variables in parametric, and the Mann-Whitney test in non-parametric data between the two groups.
RESULTS:
At the beginning of the study, one hundred fifty-one eligible patients were selected, Seventy-three people were excluded at the beginning of the study for a variety of reasons, including their unwillingness to cooperate, seventy-eight people were eventually enrolled in the study as shown in the flowchart (Figure 1). Seven patients were excluded from the study for various reasons. 64 patients (supplement group = 32, placebo group = 32) completed the study (Figure 1).
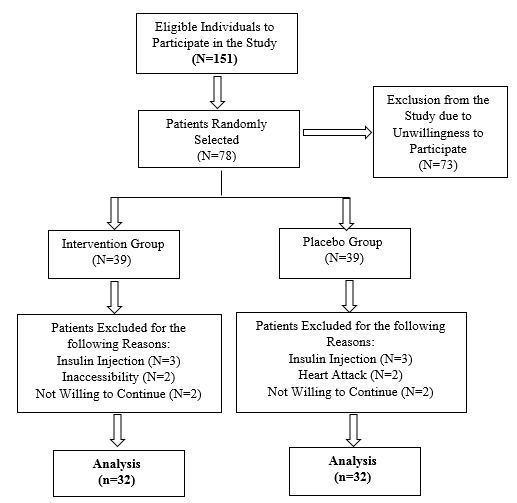
Figure 1: Flow Chart for the Trial
In this study, patients were given supplements or a placebo twice daily. Checking the remaining supplements at the end of the study showed more than 80% of supplements had been consumed, indicating high patient compliance.
Quantitative general characteristics of Type II Diabetic Patients in the intervention and placebo groups were outlined in Table 1.
Table 1: Quantitative General Characteristics of Type II Diabetic Patients in the Intervention and Placebo Groups
|
Variables* |
Intervention Group** (n = 32) |
Control Group (n = 32) |
P-value*** |
|
Age (Years) |
53.43±10.29 |
55.12±8.7 |
0.48 |
|
Weight (kg) |
83.64±11.66 |
83.32±10.61 |
0.91 |
|
BMI (kg/m²) |
31.55±5.34 |
31.59±4.86 |
0.97 |
*Values are mean ± standard.
**The intervention group consumed vitamin D, zinc, calcium, and magnesium co- supplementation.
***Obtained from independent sample t-test.
As shown in Table 1 there were no significant differences between the two groups regarding age, weight, and BMI.
Qualitative general characteristics of Type II Diabetic Patients in the intervention and placebo groups were outlined in Table 2.
Table 2: Qualitative General Characteristics of Type II Diabetic Patients in the Intervention and Placebo Groups
|
Variables* |
Category |
Intervention Group** (n = 32) |
Control Group (n = 32) |
P-value*** |
|
Duration of Disease (Years) |
Less than 5 Years |
13(40.6%) |
7(21.9%) |
0.23 |
|
Between 5 and 10 Years |
10(31.2%) |
11(34.4%) |
||
|
Over 10 Years |
9(28.1%) |
14(43.8%) |
||
|
Number of Family Members
|
Less than 3 People |
5(15.6%) |
6(18.8%) |
0.74 |
|
More than Three People |
27(84.4%) |
26(81.2%) |
||
|
Employment
|
Governmental |
2(6.2%) |
1(3.1%) |
0.75 |
|
Free |
6(18.8%) |
8(25%) |
||
|
Retired |
9(28.1%) |
11(34.4%) |
||
|
Housewife |
15(46.9%) |
12(37.5%) |
||
|
Family History of Diabetes
|
Yes |
17(53.1%) |
16(50%) |
0.8 |
|
No |
15(46.9%) |
16(50%) |
||
|
Education Level |
Illiterate |
12(37.5%) |
15(46.9%) |
0.14
|
|
School-level Literacy |
13(40.6%) |
6(18.8%) |
||
|
University-level Literacy |
7(21.9%) |
11(34.4%) |
||
|
Marital Status |
Married |
30(93.8%) |
30(93.8%) |
1.00 |
|
Single |
2(6.2%) |
2(6.2%) |
*Values are frequencies (percent).
**The intervention group consumed vitamin D, zinc, calcium, and magnesium co- supplementation.
* Obtained from Chi-square test
As shown in Table 2, demographic factors, such as education level, occupation, duration of diabetes, and marital status were not significant.
Dietary intake before and after intervention in patients with Type 2 Diabetes Mellitus is shown in Table 3.
Table 3: Dietary Intake and Physical Activity before and after Intervention in Patients with Type 2 Diabetes Mellitus (Mean Values and Standard Deviations)
|
Variables* |
Intervention Group** (n = 32) |
|
Control Group (n = 32) |
P-value*** |
|||
|
Before |
Post |
Mean Change |
Before |
Post |
Mean Change |
||
|
Kcal (kcal/d) |
2899.13±462.9 |
2920.98±441.1 |
21.84±63.66 |
2948.46±520.9 |
2998.68±464.58 |
50.21±52.03 |
0.73 |
|
Protein (g/d) |
133.28±35.99 |
126.90±41.46 |
-6.37±6.08 |
136.77±27.69 |
147.7±33.73 |
10.92±6.18 |
0.05 |
|
CHO (g/d) |
490.18±94.43 |
494.43±113.95 |
4.25±17.03 |
479.79±120.78 |
474.77±115.96 |
-5.01±17.62 |
0.7 |
|
FAT (g/d) |
62.13±27.56 |
63.78±32.42 |
1.65±4.28 |
64.86±21.43 |
66.3±24.76 |
1.44±5.12 |
0.97 |
|
Zinc (g/d) |
3.96 ± 12.73 |
4.51 ± 11.6 |
-1.13±0.73 |
4.10 ± 13.10 |
4.33 ± 14.74 |
1.63±0.97 |
0.02 |
|
Cholesterol (mg/d) |
450.92±315.71 |
395.27±268.60 |
-55.64±64.04 |
395.54±215.03 |
423.79±211.48 |
28.25±44.71 |
0.28 |
|
SFA (g/d) |
22.35±10.9 |
22.07±10.4 |
-0.27±1.76 |
27.41±12.55 |
27.76±11.05 |
0.34±2.74 |
0.85 |
|
PUFA (g/d) |
4.99±1.88 |
5.9±2.76 |
0.91±0.50 |
6.24±2.72 |
7.46±3.71 |
1.22±0.91 |
0.77 |
|
MUFA (g/d) |
14.35±5 |
14.65±5.83 |
0.30±1.10 |
15.6±6.08 |
15.72±5.28 |
0.12±1.36 |
0.91 |
|
Calcium (mg/d) |
1702.79±869.069 |
1531.89±878.06 |
-170.90±114.65 |
1719.11±762.99 |
1875.7±761.35 |
156.59±147.19 |
0.08 |
|
Magnesium (mg/d) |
348.58±99.10 |
341.48±86.8 |
-7.09±16.39 |
335.69±107.21 |
369.62±101.34 |
33.92±20.07 |
0.11 |
|
Total Fiber (g/d) |
27.65±10.08 |
28.47±8.82 |
0.61±1.84 |
29.79±11.09 |
27.81±11.06 |
-1.97±1.79 |
0.28 |
|
Vitamin D (μg/d) |
1.71±1.64 |
1.82±2 |
0.10±0.37 |
1.16±1.39 |
1.24±1.38 |
0/08±0.20 |
0.95 |
|
MET.h/d |
23.18±10.7 |
22.87±10.82 |
-0.31±0.12 |
21.28±11.42 |
23.89±9.11 |
2.61±2.31 |
0.56 |
*All values are mean ± SDs.
**The intervention group consumed vitamin D, zinc, calcium, and magnesium co- supplementation.
***Obtained from comparing mean changes values using independent sample t-test.
Kcal: kilocalorie; CHO: carbohydrate; SFA: saturated fatty acid; PUFA: polyunsaturated fatty acid; MUFA: monounsaturated fatty acid; MET: metabolic equivalent task
As shown in Table 3 During a dietary review, it was perceived that there were no significant changes in the nutrients consumed, including vitamin D, zinc, magnesium, calcium, CHO, protein, fat, SFA, PUFA, MUFA, cholesterol, and total fiber (Table 3).
Mean and standard deviations of body composition variables in intervention and placebo groups of patients with diabetes at baseline and end of the study are shown in Table 4.
Table 4. Mean and Standard Deviations of Body Composition Variables in Intervention and Placebo Groups of Patients with Diabetes at Baseline and End of the Study
|
P** |
Control Group (n = 32) |
Intervention Group* (n = 32) |
Variables |
||||||
|
P*** |
Mean Change |
Post |
Before |
P*** |
Mean Change |
Post |
Before |
||
|
0.14 |
0.99 |
0.29 ± 0.003 |
83.33±10.56 |
83.32±10.61 |
0.05 |
0.32 ± 0.64- |
82.99±11.61 |
83.64±11.66 |
Weight(kg) |
|
0.25 |
0.61 |
0.16 ± 0.08 |
31.67±5.03 |
31.59±4.86 |
0.22 |
0.12 ± 0.15- |
31.4±5.14 |
31.55±5.34 |
BMI((kg/m²) |
|
0.61 |
0.35 |
0.33 ± 0.31 |
39.08±9.29 |
38.76±9.2 |
0.57 |
0.26 ± 0.15 |
38.28±9.02 |
38.13±8.78 |
PBF(percent) |
|
0.46 |
0.42 |
0.32 ± 0.26 |
32.89±9.81 |
32.63±9.6 |
0.79 |
0.26 ± 0.07- |
32.91±11.88 |
32.99±11.7 |
BFM(kg) |
|
0.23 |
0.2 |
0.003 ± 0.004 |
0.05 ± 0.99 |
0.05 ± 0.99 |
0.29 |
0.004 ± 0.005- |
0.06 ± 0.97 |
0.01 ± 0.98 |
WHR(cm) |
|
0.85 |
0.1 |
1.6 ± 2.69 |
163.64±53.5 |
160.95±53.33 |
0.38 |
1.63 ± 1.42 |
158.86±56.24 |
157.44±55.66 |
VFA(cm²) |
|
0.47 |
0.31 |
-0.33±0.32 |
50.39±8.27 |
50.73±8.33 |
0.1 |
-0.42±0.25 |
51.55±7.51 |
51.98±7.35 |
FFM(kg) |
|
0.38 |
0.21 |
-0.23±0.18 |
27.8±5.02 |
28.03±5 |
0.03 |
-0.30±0.13 |
28.13±4.24 |
28.44±4.09 |
SMM(kg) |
*The intervention group consumed vitamin D, zinc, calcium, and magnesium co- supplementation.
** Obtained from comparing mean changes values using independent sample t-test*** Obtained from comparing before and after values using paired sample t-test.
BMI: Body Mass Index; PBF: Percent Body Fat; BFM: Body Fat Mass; WHR: Waist-Hip Ratio; SMM: Skeletal Muscle Mass; VFA: Visceral Fat Area
As shown in Table 4 there was no significant difference between the two groups in the body composition variables.
Glycemic Control, Lipid Parameters, Liver Enzymes, CRP, Blood Pressure at baseline, and after 8 weeks’ intervention in patients with Type 2 Diabetes Mellitus were outlined in Table 5.
Table 5: Glycemic Control, Lipid Parameters, Liver Enzymes, CRP, Blood Pressure at Baseline and after 8 Weeks’ Intervention in Patients with Type 2 Diabetes Mellitus (Mean Values and Standard Deviations)
|
P*** |
P** |
Control Group (n = 32) |
Intervention Group* (n = 32) |
Variable |
||||||
|
|
|
P**** |
Change |
Post |
Before |
P**** |
Change |
Post |
Before |
|
|
0.001 |
0.08 |
0.15 |
7.19±4.94 |
159.02±47.56 |
151.82±48.29 |
0.19 |
17.22±12.87- |
139.21±43.05 |
156.43±57.19 |
FBS(mg/dl) |
|
0.90 |
0.78 |
0.69 |
0.30±0.77 |
8.43±3.51 |
8.12±3.84 |
0.98 |
-0.01±0.87 |
8.36±4.16 |
8.38±3.99 |
Insulin (μU/mL) |
|
0.26 |
0.96 |
0.68 |
0.13±0.32 |
3.24±1.64 |
3.11±1.5 |
0.79 |
0.10±0.41 |
2.89±1.7 |
2.78±1.44 |
HOMA-IR |
|
0.013 |
0.04 |
0.06 |
-0.005±0.016 |
0.45±0.02 |
02/0 ± 45/0 |
0.15 |
0.01±0.006 |
0.46±0.03 |
0.45±0.03 |
QUICKI |
|
0.77 |
0.74 |
0.98 |
-0.002±0.11 |
7.96±1.96 |
7.96±1.97 |
0.37 |
0.18±0.19 |
7.64±1.75 |
7.46±1.41 |
HbA1C (percent) |
|
0.54 |
0.21 |
0.35 |
12.20±12.92 |
171.13±61.75 |
158.93±70.09 |
0.40 |
-12.9±15.27 |
146.32±85 |
159.23±84.93 |
TG(mg/dl) |
|
0.0001 |
0.46 |
0.43 |
-6±7.58 |
172.48±41.92 |
178.48±36.04 |
0.001 |
12.15±3.48- |
167.81±32.76 |
179.96±31.32 |
Cholesterol (mg/dl) |
|
0.71 |
0.81 |
0.05 |
1.21 2.44± |
48.25±10.77 |
45.81±10.43 |
0.16 |
2±1.42 |
45.5±10.96 |
43.5±8.37 |
HDL(mg/dl) |
|
0.07 |
0.62 |
0.22 |
-5.63±4.54 |
85.84±21.77 |
91.52±24.45 |
0.08 |
-5.86±3.26 |
90.83±24.87 |
96.69±24.29 |
LDL(mg/dl) |
|
0.58 |
0.26 |
293/0 |
-3.15±2.93 |
33.26±14.44 |
36.42±14.02 |
0.01 |
-5.52±2.23 |
31.47±12.87 |
37±14.87 |
VLDL (mg/dl) |
|
0.96 |
0.70 |
0.32 |
-1.03±1.34 |
21.43±6.44 |
22.46±6.35 |
0.23 |
-1.44±1.19 |
20.58±5.38 |
22.03±6.03 |
AST (U/L) |
|
0.60 |
0.71 |
0.69 |
0.90±2.27 |
26.09±10.94 |
25.19±10.83 |
0.31 |
-2±1.94 |
22.74±10.25 |
24.74±10.96 |
ALT (U/L) |
|
0.36 |
0.05 |
0.72 |
3.21±8.99 |
186.9±43.8 |
183.68±47.14 |
0.07 |
-14.70±8.03 |
169.24±45.55 |
183.94±51.87 |
ALP (U/L) |
|
0.001 |
0.40 |
0.44 |
3.21±8.99 |
28.38±12.41 |
28.89±11.55 |
0.64 |
-5.47±2.48 |
22.53±7.92 |
28.01±14.30 |
GGT(U/L) |
|
0.31 |
0.24 |
0.10 |
-0.02±0.015 |
0.42±0.14 |
0.44±0.02 |
0.007 |
-0.05±2.48 |
0.38±0.17 |
0.02±0.43 |
CRP(mg/dl) |
|
0.68 |
0.001 |
0.26 |
1.31±1.16 |
11.56±18.28 |
110.25±17.96 |
0.0001 |
13.84±0.93 |
122.75±15.85 |
108.9±16.39 |
Zinc(mg/dl) |
|
0.89 |
0.92 |
0.06 |
-0.40±0.21 |
12.49±1.25 |
12.09±1.47 |
0.03 |
-0.43±0.19 |
12.64±1.13 |
13.07±1.69 |
Systolic Blood Pressure (mmHg) |
|
0.07 |
0.93 |
0.33 |
-0.14±0.14 |
74/0 7.95± |
8.09±1.08 |
0.27 |
-0.15±0.13 |
0.76± 8.12 |
8.28±1.18 |
Diastolic Blood Pressure mmHg) |
*The intervention group consumed vitamin D, zinc, calcium, and magnesium co- supplementation.
** Obtained from comparing mean changes values using independent sample t-test*** P values represent ANCOVA by adjusting the baseline values biochemical parameters.
**** Obtained from comparing before and after values using paired sample t-test.
FBS: fasting blood sugar; HOMA-IR: homoeostasis model for assessment of estimated insulin resistance; QUICKI, quantitative insulin sensitivity check index; CRP, C-reactive protein; LDL: low-density lipoprotein; HDL: high- density lipoprotein; VLDL: very-low-density lipoprotein; TG: triglyceride AST: aspartate aminotransferase; ALT: alanine aminotransferase; ALP: Alkaline phosphatase; GGT: Gamma-Glutamyl Transpeptidase
As shown in Table 5, after eight weeks of intervention, compared with placebo, vitamin D, zinc, calcium, and magnesium co-supplementation significantly increased QUICKI and reduced FBS. Compared to the control group, other glycemic indexes, including insulin were reduced but were not statistically significant. There was also no significant decrease in HbA1C and HOMA-IR.
In addition, supplementation significantly decreased cholesterol, compared with the placebo. Other lipid profile factors including triglyceride, HDL, VLDL, and LDL were not significantly different between the two groups.
Supplementation led to a significant decrease in GGT levels, compared with a placebo. Hepatic enzymes other than ALT, AST, ALP were not statistically significant between the two groups.
It was also observed that there was no significant effect on measured factors such as blood pressure and CRP.
DISCUSSION:
The present study investigated vitamin D, zinc, calcium, and magnesium co-supplementation after eight weeks of intervention in sixty-two patients; this supplement had beneficial effects on QUICKI, FBS, Cholesterol, and GGT enzyme although there was no significant effect on residual Glycemic index, lipid profile, and liver enzymes as well as measured factors of body composition, blood pressure, and CRP. Supporting the present findings, Asemi et al. (2016) demonstrated that co-supplementation with vitamin D, calcium, and potassium significantly increased QUICKI, and decreased HOMA-IR and insulin after twelve weeks of intervention, while FBS was not statistically changed [18]. In Karamali et al.’s (2018) study, combined supplementation of vitamin D, zinc, calcium, and magnesium significantly decreased insulin, HOMA-IR, fasting blood glucose, and QUICKI in gestational diabetes mellitus [23]. While in the current study only QUICKI and FBS were ameliorated significantly. This disparity could be interpreted by insulin injection in patients with gestational diabetes, which, in addition to supplementation, had a role in regulating blood sugar. Zinc, due to its structural role in insulin [25-28], calcium, and vitamin D due to increases in the expression of insulin receptors [29], and magnesium through phosphorylation of tyrosine kinase enzyme [30, 31], led to improving insulin secretion and finally better control of blood sugar.
A study by Tabesh et al. (2014) showed that calcium supplementation with vitamin D resulted in improved lipid profiles among patients with type 2 diabetes [32]. Additionally, Kim et al. (2018) administered zinc, magnesium, and chromium supplements to individuals with metabolic syndrome for 24-week that showed no significant effect on HDL and triglycerides, and is consistent with the present study [21]. In a study by Asemi et al. (2014), cholesterol in patients with gestational diabetes who received a combination of vitamin D and calcium did not decrease significantly [33], due to the discrepancy between the different study populations and the dose rates used in the study. Calcium, zinc, and vitamin D could improve lipid profile and insulin resistance by inhibiting lipolysis and decreasing the release of fatty acids [34-36], while magnesium increases lipoprotein lipase activity [37, 38].
A study by Karandish et al. (2013) showed that magnesium supplementation in obese people improved liver enzymes [39], and Nader pur et al.’s study (2018) showed that after sixteen weeks of vitamin D supplementation, liver enzymes, including GGT, improved [40]. Vitamin D and magnesium inhibit hepatic stellate cell proliferation by inhibiting fibrotic gene expression and frostatin, respectively [41-43]. Zinc also improves liver damage by extracellular ATP normalization and adenosine production [44, 45].
Kim et al.’s (2018) study that investigated the effect of co-supplementation of zinc, magnesium, and chromium on patients with metabolic syndrome showed no significant effect on blood pressure [21], which is consistent with the present study. In the study by Asemi et al. (2016) on patients with diabetes with a history of myocardial infarction, consuming vitamin D, calcium, and potassium supplements decreased CRP significantly [18], which is inconsistent with the results of the present study. One reason for the discrepancy was elevated levels of CRP in patients with a history of myocardial infarction but in the present study, patients had a low baseline level of CRP.
Several strengths exist in the present study; this study is the first randomized controlled clinical trial using concomitant use of zinc, vitamin D, calcium, and magnesium in the form of a tablet on the glycemic index, lipid profile, liver enzyme, CRP, body composition and blood pressure that was designed in type 2 diabetic patients, additionally, body composition profiles were determined using a BIA device.
The current study had some limitations, one of which is that we could not evaluate the effect of this supplementation on other inflammatory factors, such as IL1 and IL6, and oxidative stress. Due to limited resources and facilities, we were unable to measure some of the tests that increased the study, including the gold test for insulin resistance such as euglycemic clamp and blood levels of vitamin D, calcium, and magnesium in this study.
CONCLUSION:
Overall, vitamin D, zinc, calcium, and magnesium co-supplementation for eight weeks among patients with diabetes had beneficial effects on glycemic control, cholesterol, and GGT. However, it did not have a significant effect on other components of lipid profile, liver enzymes parameters, body composition, blood pressure, and CRP. Future studies are recommended to compare the individual effects of these elements with a combination of supplements and to see which complementary effects are more effective.
REFERENCES