International Journal of Pharmaceutical and Phytopharmacological Research
ISSN (Print): 2250-1029
ISSN (Online): 2249-6084
|
The Effect of Fenofibrate Combined with Α-Lipoic Acid on Rats Fed with High Fat Diet
Babak Hassankhan 1, Parichehreh Yaghmaei 1*, Kazem Parivar 1, Azadeh Ebrahim-Habibi2,3 |
|
1 Department of Biology, Science and Research Branch, Islamic Azad University, Tehran, Iran 2 Biosensor Research Center, Endocrinology and Metabolism Molecular-Cellular Sciences Institute, Tehran University of Medical Sciences, Tehran, Iran 3 Endocrinology and Metabolism Research Center, Endocrinology and Metabolism Clinical Sciences Institute, Tehran University of Medical Sciences, Tehran, Iran. |
ABSTRACT
Purpose: Fenofibrate is one of the most important drugs for the management of dyslipidemia and α-lipoic acid has a potent antioxidant effect. The present study aimed to investigate the effect of fenofibrate in combination with α-Lipoic acid on the prevention of hypertriglyceridemia and oxidative stress in high fat diet fed rats. Methods: Male Sprague-Dawley rats were divided into five groups (n= 8 in each group): normal control group (NC) to receive a standard chow and four high-fat diet-fed groups to receive a high-fat emulsion diet alone (HFD), in combination with 100 mg/kg fenofibrate (Fen), in combination with 60 mg/kg α-Lipoic acid group (Lip) and in combination with 50 mg/kg fenofibrate and 30 mg/kg α-lipoic acid (Fen+Lip). Hypertriglyceridemia and oxidative stress was induced by oral gavage of high-fat emulsion diet after six weeks. Rats were simultaneously treated with fenofibrate alone and in combination with α-lipoic acid. Results: Fenofibrate treatment without α-lipoic acid improved hypertriglyceridemia. It increased the plasma level of alanine aminotransferase (ALT) without effect on hepatic content of Malondialdehyde (MDA). Fenofibrate in combination with α-lipoic acid also improved hypertriglyceridemia but did not increase the plasma level of ALT. It potently reduced hepatic content of triglyceride and MDA. Conclusion: Our results suggest that fenofibrate in combination with α-lipoic acid showed higher protect effect on hypertriglyceridemia and oxidative stress compared to the fenofibrate alone. Furthermore α-lipoic acid could reduce toxic or side effects of fenofibrate.
Key Words: Hypertriglyceridemia, oxidative stress, Fenofibrate, α-Lipoic acid, High fat emulsion diet.
A high-fat diet (HFD) adversely affects the health of humans and animal species. Excess energy intake and abnormal lipid metabolism are main causes of hypertriglyceridemia. [1] Hypertriglyceridemia is a feature in subjects with obesity, the metabolic syndrome or type 2 diabetes mellitus. It is a risk factor for the development of cardiovascular disease (CVD). [2] Regulating the synthesis and reabsorption of lipids by fat-lowering agents may be useful pharmacological interventions to improve dyslipidaemia. [3]
A high-fat diet and accumulation of lipids in the hepatocyte increase microsomal pathways of fat oxidation and trigger production of inflammatory cytokines. [4] High levels of fat increase oxidative stress and decrease antioxidative enzyme activity. Antioxidant supplementation has beneficial effects in improvement of hypertriglyceridemia. [1]
Peroxisome proliferator-activated receptors (PPARs) are ligand-activated transcription factors and play a major role in metabolism. Between the three well-known groups of these receptors, PPARα type is expressed more in tissues dealing with fat catabolism, such as liver and adipose tissue. Fibrates are used in the treatment of dyslipidemia and fenofibrate can bind to PPARα receptors. Fenofibrate improves dyslipidemia and reduces risk of cardiovascular disease. Although fenofibrate is considered safe in humans, it can cause oxidative stress and lipid peroxidation in rodents. [5]
α-lipoic acid is a natural compound and acts as a cofactor for mitochondrial enzymes. α-lipoic acid has a potent antioxidant effect, can interact with other antioxidants, and regenerate them. For this reason, it is called an antioxidant of the antioxidants. [6] α-lipoic acid is used in a number of diseases relating to oxidative stress and liver disease. Furthermore α-lipoic acid is a weak PPARα agonist. Thus, it seems to be useful in improvment the symptoms of metabolic syndrome. [7]
Hence, this study aimed to test and compare the efficacy of fenofibrate alone and in combination with α-lipoic acid on hypertriglyceridemia and oxidative stress in high fat diet fed rats.
MATERIALS AND METHODS
Animals and diets
Forty male Sprague-Dawley rats were kept in plastic cages at temperature of 22-24 ° C under a 12 - h light /dark cycle. They were allowed free access to standard rodent chow and water. Animals were kept at laboratory for one week. After adaptatation, they were weighed and divided into the following five groups (n= 8 in each group): normal control group (NC) to receive a standard chow and four high-fat diet-fed groups to receive a high-fat emulsion diet alone (HFD), in combination with 100 mg/kg fenofibrate (Fen), in combination with 60 mg/kg α-Lipoic acid group (Lip) and in combination with 50 mg/kg fenofibrate and 30 mg/kg α-lipoic acid (Fen+Lip). Hypertriglyceridemia and oxidative stress was induced by high-fat emulsion diet (HFD) as previously described. [8] HFD was prepared based on 77% of its energy from fat, 14% from total milk powder and 9% from carbohydrate. In this emulsion, fat was provided by corn oil (shown in Table 1). HFD was administered to the rats once a day via oral gavage for six weeks. . For the determination of effective dosage of fenofibrate and α-Lipoic acid, previous studies were considered. [9-11] Rats in the drug-administered groups were treated by oral gavage with a solution of propylene glycol [10], containing the drug at the indicated concentration, once a day for six weeks simultaneous the induction of hypertriglyceridemia. Rats in the non-drug-administered groups received propylene glycol without drug, according to the same time schedule. The experimental protocol was performed in accordance with the international guidelines established in the Guide for the Care and Use of Laboratory Animals (Institute of Laboratory Animal Resources, 1996) and further approved by the Ethics Committee of the Science and Research Branch, Azad University, Tehran.
Evaluation of animal and organ weights
At the end of the six weeks of the diet, the animals were weighed and anesthetized by diethyl ether in inhalation way. Liver was immediately removed with caution, washed by normal saline and weighed. A part of the liver tissue was placed in 10% formalin buffer solution for histological evaluations. Other part of the liver tissue was homogenized in a 50 mM phosphate buffer solution (pH = 7) and kept at - 80 ° C until the test time. The retroperitoneal adipose tissue was quickly isolated for the determination of gene expression. It was submerged in nitrogen and immediately stored at - 80 ° C until analysis.
Serum analysis
At the end of the six weeks and 14 hours after fasting, Blood sampling was performed using a 5-cc syringe from the heart ventricle. Blood samples were placed at room temperature and then serum separated by centrifuge and kept at a temperature of - 20 ° C until analysis. Serum fasting glucose, triglyceride (TG), total cholesterol (TC), high-density lipoprotein cholesterol (HDL-C), low-density lipoprotein cholesterol (LDL-C), alanine minotransferase (ALT), aspartate aminotransferase (AST) were determined by enzymatic method using individual commercial kits (Zist Chimi Chemical Company, Tehran, Iran). Serum adiponectin, tumor necrosis factor α (TNFα) insulin level (CUSABIO Diagnostic, Japan) were quantified with ELISA kits. The insulin resistance index was evaluated by the homeostasis model assessment of insulin resistance (HOMA-IR). [12]
HOMA-IR = fasting serum Insulin (µU/ml) × fasting plasma glucose (mmol/l) / 22.5
Hepatic lipid quantitation and lipid peroxidation
The hepatic activity of superoxide dismutase (SOD) was evaluated by measuring the percentage inhibition of the pyrogallol auto oxidation by SOD according to the method Marklund & Marklundand. [9] Hepatic malondialdehyde (MDA) was measured to evaluate the degree of oxidative stress by the method proposed by Buege and Aust. [11] Hepatic concentration of TC and TG was estimated using commercially colorimetric assay kits (Zist Chimi Chemical Company, Tehran, Iran) after chloroform-methanol extraction according to the Floch method. [8]
Histological examination
Histological changes in liver tissues were detected by H&E staining as previously described. [8] Liver tissue was placed in 10% formalin solution for dehydration. After 48 h, paraffin was added to the tissue and staining was performed by hematoxylin - eosin. The samples were cut into 5-µm section according to routin protocols and examined by optical microscopy.
RNA extraction and qRT-PCR
Total RNA was extracted from animals’ retroperitoneal adipose tissue by using buffer component, proteinase K, RNX-Plus reagent (CinnaGen Company, Iran) according to the manufacturer’s procedure. RNA was treated with DNAse-1 (Fermentas Inc., Vilnius, Lithuania) and assessed with spectrophotometry at 260 and 280 nm (Biophotometer, Eppendorf, Hamburg, Germany) to ensure that any DNA and protein had been removed then, samples were kept at - 80 ° C until analysis. For cDNA synthesis, random hexamer, Oligo (dt) and dNTP (CinnaGen Company, Iran) were used based on the previous studie. [12] The primer sequences for peroxisome proliferator-activated receptor-γ coactivator-1α (PGC-1α), uncoupling protein 1 (UCP1) and glyceraldehyde-3-phosphate dehydrogenase (GAPDH) (used as a housekeeping gene) were obtained from the National Center for Biotechnology Information (NCBI) website. Specific primers were designed by the Primer express program (shown in Table 2).
Real-time PCR relative quantification was performed using the ABI-step system by measuring the increase in fluorescence emission resulting from SYBR Green (Fermentas Inc., Vilnius, Lithuania). A reaction without cDNA was used as a negative control. Reactions were performed in triplicate. Gene expression assessment was performed using the 2(- delta delta ct) method. The level of PGC-1α and UCP1 gene expression was reported based on the relative quantitation (RQ) assay. [12]
Statistical analysis
Data processing was performed using SPSS 16.0 statistical soft ware. One-way ANOVA was used, and the results were expressed as the mean ± SEM (standard error of the mean) followed by Tukey’s post hoc test. The level of statistical significance was set at (p < 0.05).
RESULTS
Body and liver weight alterations
At the end of the experimental period, no significant differences were found in the body weight gain and liver weight in the HFD group compared to the NC group but all treated animal groups showed a marked decrease in body weight gain compared to the NC group (P<0.05). Liver weight increased significantly in Fen and Fen+Lip groups compared to the HFD group (P<0.05). (Table 3).
Serum biochemistry
Compared to the NC group, the HFD group displayed a significant increase in serum lipids profile (P<0.05). Fenofibrate and fenofibrate in combination with α-lipoic acid decreased significantly serum lipids profile of all treated groups compared to the HFD group (P<0.05). Serum TNFα significantly increased and serum adiponectin significantly decreased in all groups to receive HFD compared to the NC group (P<0.05) Fenofibrate and fenofibrate in combination with α-lipoic acid did not alter the serum concentrations of adiponectin and TNFα in all treated groups compared to the HFD group (P>0.05). Serum ALT level significantly increased in HFD group compared to the NC group (P<0.05) and in Fen and Lip groups compared to the HFD group (P<0.05) but in Fen+Lip group no significant change were observed compared to the HFD group (P>0.05) (Fig.1. B). Serum insulin level and insulin resistance based on HOMA index increased significantly in all groups to receive HFD compared to the NC group (P<0.05). In all treated groups, no significant difference were found in the level of these factors compared to the HFD group (P>0.05) (Table3).
Hepatic lipid content and lipid peroxidation
High-fat diet significantly increased the hepatic content of triglyceride (TG) and total cholesterol (TC) in the liver tissue of HFD group compared to the NC group (P<0.05). In all treated groups, a significant decrease were observed in the level of hepatic content of TC and TG compared to the HFD group (P<0.05). No significant differences were found in hepatic SOD activity in the HFD group compared to the NC group. Fenofibrate significantly decreased the hepatic SOD activity in Fen group compared to the NC group but in Fen+Lip group, no significant change were observed between this group and NC group (P>0.05) (Fig.1. C). Compared to the NC group, hepatic content of MDA as a marker for lipid peroxidation significantly increased in HFD group. Hepatic concentrations of MDA was not decreased by oral administration of fenofibrate but fenofibrate in combination with α-lipoic acid significantly decreased the hepatic content of MDA in Fen + Lip group compared to the HFD group (P<0.05) (Fig.1. D).
Liver Histology
As shown in Fig.3, after six weeks of high-fat emulsion diet feeding, liver sections from the high-fat emulsion model group displayed obvious fat droplets and macro-vesicular steatosis around the periportal zone that was confirmed by H&E staining (Fig. 3B). Liver histological changes were not observed in rats fed a normal diet (Fig. 3A). Fenofibrate in combination with α-lipoic acid attenuated the hepatic steatosis and fat droplets in the liver. Particularly, it showed greater improvement in fat droplets attenuation than fenofibrate treatment alone (Fig.3D and 3E).
Expression PGC-1α and UCP1 mRNA in adipose tissues of rats
Using high-fat emulsion diet caused decrease of PGC-1α and UCP1 mRNA expression. Fenofibrate enhanced expression of PGC-1α and UCP1 more than the control level. Meanwhile, fenofibrate in combination with α-lipoic acid increased PGC-1α and UCP1 expression more potently than fenofibrate alone in adipose tissue (Fig.2A and Fig.2B).
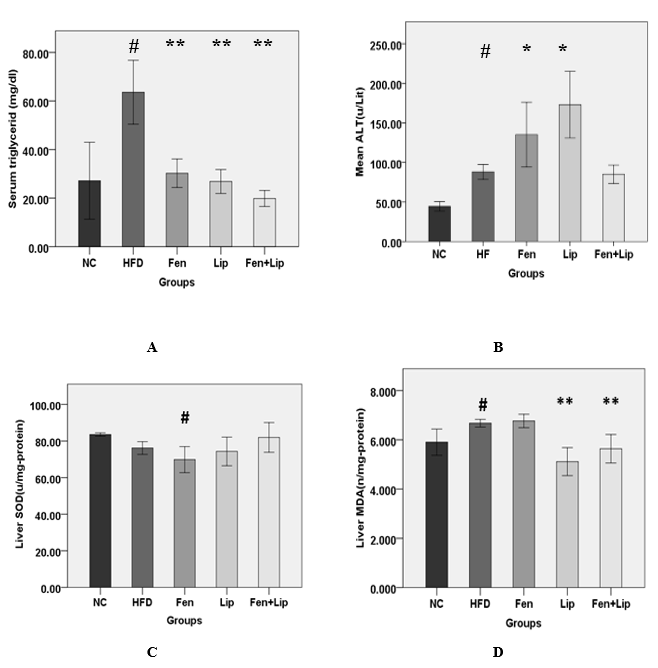
Figure 1. Effect of fenofibrate, α-lipoic acid and fenofibrate in combination with α-lipoic acid on serum triglyceride level (TG) (A), the concentration of serum alanine minotransferase level (ALT) (B), liver superoxide dismutase activity (SOD) (C) and hepatic content of malondialdehyde (MDA) (D). Normal control group (NC), high-fat diet feeding group (HFD), HFD + fenofibrate group (Fen), HFD + α-Lipoic acid group (Lip) and HFD + fenofibrate in combination with α-lipoic acid group (Fen+Lip). Values represent mean ± SEM. Statistical analysis was performed using one-way ANOVA with Tukey’s post-hoc test. Compared with the HFD group: * P < 0.05. Compared with the HFD group ** P < 0.01. Compared with the NC group: # P < 0.05. Compared with the NC group: ## P < 0.01.
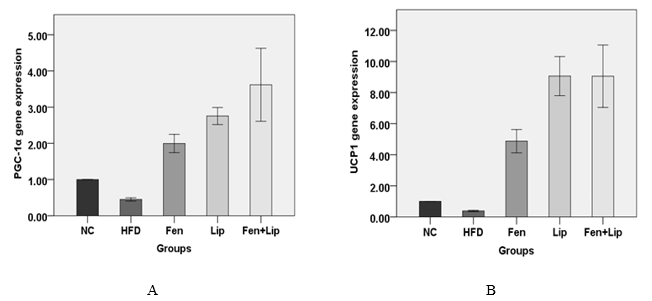
Figure 2. Effects of fenofibrate, α-lipoic acid and fenofibrate in combination with α-lipoic acid on PGC-1α (A) and UCP1 (B) mRNA expression. Normal control group (NC), high-fat diet feeding group (HFD), HFD + fenofibrate group (Fen), HFD + α-Lipoic acid group (Lip) and HFD + fenofibrate in combination with α-lipoic acid group (Fen+Lip).
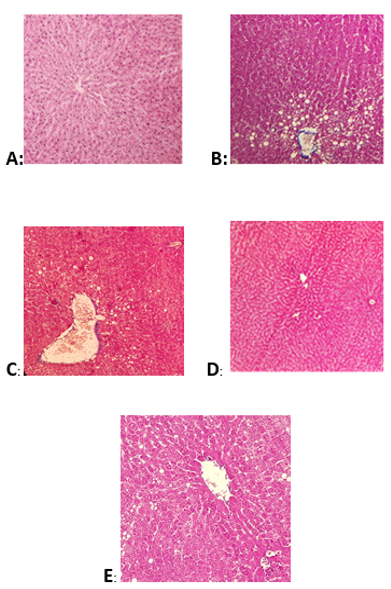
Figure 3. Pathological changes of liver tissues in each group. The sections were stained for hematoxylin and eosin. Normal control group (A), high-fat diet feeding group (B), HFD + fenofibrate group (C), HFD + α-Lipoic acid group (D) and HFD + fenofibrate in combination with α-lipoic acid group (E).
Table 1. The composition and caloric content of the high-fat emulsion diet ingested via gavage in rats.8
|
Component |
High-fat emulsion |
|
Corn oil (g) |
400 |
|
Saccharose (g) |
150 |
|
Total milk powder (g) |
80 |
|
Cholesterol (g) |
100 |
|
Sodium deoxycholate (g) |
10 |
|
Tween 80 (g) |
36.4 |
|
Propylene glycol (g) |
31.1 |
|
Vitamin mixture (g) |
2.5 |
|
Cooking salt (g) |
10 |
|
Mineral mixture (g) |
1.5 |
|
Distilled water (ml) |
300 |
|
Total energy |
(4342 kcal/l) |
Table 2. Primer Sequences for real-time PCR amplification.
|
Gen |
Sequence |
|
UCP1 (Forward) |
5/-AGAGGTGGTGAAGGTCAGAATGC |
|
UCP1 (Reverse) |
5/-TCCACAGTGTTGACAAGCTTTCTG |
|
PGC-1α (Forward) |
5/-GCTGAAGCCCTCTTGCAAGAC |
|
PGC-1α (Reverse) |
5/-ACTGAGGACTTGCTGAGTTGTGC |
|
GAPDH (Forward) |
5/-CAACTCCCATTCTTCCACCTTTG |
|
GAPDH (Reverse) |
5/-CTGTTGCTGTAGCCATATTCATTGTC |
PGC-1α, Peroxisome proliferator-activated receptor-γ coactivator-1α; UCP1, Uncoupling protein1; GAPDH, Glyceraldehyde-3-phosphate dehydrogenase.
Table 3. Changes of body weight gain, liver weight and concentration of serum TG, triglyceride; TC, total cholesterol; HDL-C, high density lipoprotein-cholesterol; LDL-C, low density lipoprotein-cholesterol; VLDL-C, Very low density lipoprotein-cholesterol; AST, aspartate aminotransferase; ALT, alanineaminotransferase; Adipo, Adiponectin; Glucose, Insulin level and HOMA Index, Liver TG, Liver triglyceride; Liver TC, Liver total cholesterol; in each group of rats.
|
Group |
NC |
HFD |
Fen |
Lip |
Fen + Lip |
|
Body weight gain(g) |
69.33±6.4 |
52.83±16.38 |
18.05±7.86## |
18.00±9.39## |
36.42±12.21## |
|
Liver weight(g) |
10.01±0.68 |
11.21±0.91 |
16.21±1.16** |
10.28±1.29 |
16.94±3.19** |
|
TG (mg/dl) |
63.60±18.39 |
63.60±18.39## |
30.24±5.60 ** |
26.84±5.91** |
19.38±3.91** |
|
TC (mg/dl) |
47.16±7.62 |
96.16±36.05## |
50.11±9.07** |
46.98±6.32** |
33.63±9.70** |
|
HDL-C(mg/dl) |
33.96±11.39 |
43.11±9.92 |
38.89±6.77 |
44.01±9.83 |
32.63±9.70 |
|
LDL-C(mg/dl) |
21.99±2.78 |
67.91±30.05## |
17.66±3.59** |
16.63±4.67** |
9.63±3.19** |
|
VLDL(mg/dl) |
5.43±3.01 |
15.21±6.85## |
6.25±0.99** |
5.36±1.18** |
3.96±0.78** |
|
AST(U/L) |
147±24 |
282±42## |
240±28 |
311±38 |
243±37 |
|
ALT(U/L) |
44±5.7 |
88±14# |
135±38* |
173±50** |
85±13 |
|
Adipo.(pg/dl) |
6.70±0.55 |
5.05±0.98# |
4.38±0.35 |
5.30±0.33 |
4.90±0.33 |
|
TNFα(Pg/ml) |
105.43±9.6 |
121.58±10.12# |
124.51±4.38 |
117.38±5.10 |
121.63±6.11 |
|
Glucose (mg/dl) |
113.1±20.2 |
155.2±40.9 |
140.2±24.3 |
128.5±23.3 |
160.0±25.2 |
|
Insulin (nIU/ml) |
335.5±56.1 |
437.7±36.1# |
446.9±23.0 |
427.2±11.1 |
442.3±25.3 |
|
HOMA Index |
0.08±0.02 |
0.16±0.05# |
0.15±0.02 |
0.13±0.02 |
0.17±0.02 |
|
Liver TG (mic.mol/g.tissue) |
13.79±0.71 |
14.35±0.73# |
13.39±1.01* |
12.31±0.88* |
11.88±0.62* |
|
Liver TC (mic.mol/g.tissue) |
11.72±0.74 |
12.80±0.49# |
11.55±1.77* |
11.23±1.74* |
11.47±1.60* |
Normal control group (NC), high-fat diet feeding group (HFD), HFD + fenofibrate group (Fen), HFD + α-Lipoic acid group (Lip) and HFD + fenofibrate in combination with α-lipoic acid (Fen+Lip). Values represent mean ± SEM. Statistical analysis was performed using one-way ANOVA with Tukey’s post-hoc test. Compared with the HFD group: * P < 0.05. Compared with the HFD group: ** P < 0.01. Compared with the NC group: # P < 0.05. Compared with the NC group: ## P < 0.01.
DISCUSSION
In this study, oral administration of high-fat emulsion diet to rats induced hypertriglyceridemia, insulin resistance, lipid peroxidation and steatosis. Administration of fenofibrate significantly altered hypertriglyceridemia in rats but it increased the plasma level of alanine aminotransferase (ALT) without effect on hepatic content of malondialdehyde (MDA). Fenofibrate in combination with α-lipoic acid also improved hypertriglyceridemia but it decreased the plasma level of ALT and hepatic content of MDA.
The present study showed that high-fat emulsion diet did not increase body weight in the HFD group, and obesity was not seen in this group compared to the normal control group. Previous reports suggest that the composition of fatty acids in the diet plays major role in body weight gain and saturated fatty acids have more effects on obesity and weight gain than unsaturated fatty acids. [13] Corn oil contains high values of unsaturated fatty acids. [14] Results of this experiment are agreement with these reports.
Fenofibrate and fenofibrate in combination with α-lipoic acid decreased body weight gain and they caused weight loss in rats. Fenofibrate effects on lipid metabolism, increases energy consumption and reduces body weight by effect on liver metabolism. [15] AMP-activated protein kinase (AMPK) activates peroxisome proliferator-activated receptor-γ coactivator-1α (PGC-1α) as a regulator of mitochondrial biogenesis in the cells. α-lipoic acid activates AMPK-PGC-1α pathway and increases the energy consumption and induces body weight reduction in rats. [16] In addition, α-lipoic acid reduces food intake and regulates the body weight by lowering AMPK activity in the hypothalamus. [17]
In this study, fenofibrate significantly increased liver weight and induced hepatomegaly. Activation of PPARs induces different effects on rodents compared to the humans. [18] The stimulation of these receptors causes hepatomegaly and liver toxicity in rats. [5]
The present study showed that high-fat emulsion diet increased the serum level of TC, TG, LDL-C, and VLDL but the levels of these parameters were decreased by administration of fenofibrate and fenofibrate in combination with α-lipoic acid in all treated groups. Excess energy intake and abnormal lipid metabolism are main causes of hypertriglyceridemia. [1] PPARα receptor agonists such as fenofibrate increases fatty acids oxidation and reduces circulating triglyceride level and dyslipidemia. [3] Another study revealed that α-lipoic acid prevents dyslipidemia by increasing beta-oxidation and reducing the synthesis of cholesterol. [1] α-lipoic acid improves fat disorders through its antioxidant and anti-inflammatory properties. [19] It also reduces the concentration of triglyceride in the serum and liver. [20] α-lipoic acid stimulates the activity of AMPK as an intracellular energy sensor. [21]
In this study, fenofibrate significantly decreased the activity of superoxide dismutase (SOD) and increased the hepatic content of MDA in Fen group but in animals that treated with combination of fenofibrate and α-lipoic acid, SOD activity increased and MDA concentration decreased. One of the side effects of fenofibrate is increasing lipid peroxidation. [11] Fenofibrate in rodents causes hepatotoxicity and cancer. Fibrates increas the level of factors that are involved in the production of reactive oxygen species (ROS) and oxidative stress. [5] Superoxide dismutase (SOD) is an enzyme, which disables oxidizing agents such as active oxygen species. [22] Oxidative stresses also cause lipid peroxidation and MDA formation. [23] Reactive oxygen species (ROS) such as anion superoxide are free radicals that created as a result of oxygen cellular metabolism. It can attack lipids and unsaturated fatty acids in the cell and cause lipid peroxidation. [2] The result of these reactions is the production of compounds with carbonyl group such as MDA. It can migrate and cause harmful effects on proteins and DNA in the cell. [24] MDA is a toxic compound which is considered as a marker for lipid peroxidation. [25] α-lipoic acid has a strong antioxidant property. [6] Results of this syudy suggest that fenofibrate in combination with α-lipoic acid reduces oxidative stress and lipid peroxidation that were produced by HFD or fenofibrate.
Previous studies have indicated that fenofibrate increases the level of aminotransferases in rats. [26] Moreover α-lipoic acid increases alanine aminotransferase (ALT) level. [10] In parallel with these studies, Results of this experiment revealed that serum ALT level increased in treatment with fenofibrate or α-lipoic acid but in administration of fenofibrate in combination with α-lipoic acid that performed with half dose of compounds, enhancement of ALT was not observed. This result may correlat with the dose of these compounds.
The results of this study indicated that fenofibrate decreased intrahepatic cholesterol and triglyceride, but fenofibrate in combination with α-lipoic acid showed greater improvement in the level of intrahepatic cholesterol and triglyceride than fenofibrate alone. The accumulation of cholesterol in the liver is one of the causes of hepatotoxicity. [27] Cholesterol in the liver causes inflammation and liver damage. [28] Studies have shown that fenofibrate reduces the synthesis of cholesterol, increases the LDL-C clearing and cholesterol secretion into the bile. [29] In addition, α-lipoic acid improves lipid profile in the liver. [30] α-lipoic acid increases β-oxidation and reduces the accumulation of triglyceride and steatosis by stimulating AMPK.[31]
The present study showed that the expressions of PGC-1α were decreased after administration of high-fat emulsion diet. Fenofibrate increased PGC-1α gene expression in adipos tissue but fenofibrate in combination with α-lipoic acid showed greater improvement in the PGC-1α gene expression than fenofibrate alone. PGC-1α is involved in homeostasis of energy and metabolism of glucose. It increases the expression of the UCP1 gene in brown fat tissue. [32] Reduction in gene expression of PGC-1α in fat tissue is associated with insulin resistance. [33] Studies show that PGC-1α has protective effects on the development of insulin resistance and activates the expression of GLUT4. [34] PGC-1α also plays major role in energy consumption and heat generation. [35] Previous studies have shown that fenofibrate increases the expression of PGC-1α gene. [36] In addition, α-lipoic acid has stimulating effect on expression of PGC-1α gene. [20, 37] The expressions of UCP1 gene significantly increased in all treated groups compared to the HFD group. Uncoupling protein-1 (Ucp1) in mitochondrial inner membrane involves in energy balance. α-lipoic acid increases UCP1 gene expression and energy consumption in rodents. [38] Previous reports have shown that fenofibrate increases the expression of the UCP1 gene. [36]
CONCLUSION
Our results suggest that half dose of fenofibrate in combination with α-lipoic acid improves hypertriglyceridemia similar to full dose of fenofibrate alone without elevation of serum ALT level and oxidative stress in male Sprague–Dawley rats fed with high-fat emulsion diet. α-lipoic acid may improve effects of low dose of fenofibrate and reduce its toxic and side effects. Thus, it seems that fenofibrate in combination with α-lipoic acid may be more effective than fenofibrate alone for improvement of dyslipidemia and oxidative stress resulting from a high-fat diet.
Ethical Issues
The experimental protocol was performed in accordance with the international guidelines established in the Guide for the Care and use of Laboratory Animals (Institute of Laboratory Animal Resources, 1996) and further approved by the University’s Internal Ethics committee (approval code: IR.IAU.SRB.REC.1397.122). Concerning Ethical Clearance : the protocol was approved by the Animal Ethics Committee of the Science and Research Branch, Azad University, Tehran.
Conflict of interest statement
The authors declare that they have no conflict of interest.
ACKNOWLEDGMENT
This research has been performed in the laboratory complex of the Sience and Research Branch of Islamic Azad University of Tehran.
REFERENCES