International Journal of Pharmaceutical and Phytopharmacological Research
ISSN (Print): 2250-1029
ISSN (Online): 2249-6084
|
Measurement of M-mode and B-mode echocardiographic Reference values in Domestic rabbits ‘Oryctolagus cuniculus’ Reza Behmanesh1, Mohammad Nasrollahzadeh Masouleh1*, Ehsan Khaksar2, Saeid Bokaie3 |
|
1 Department of Radiology; Faculty of Specialized Veterinary Science, Science and Research Branch, Islamic Azad University, Tehran, Iran. 2 Department of Small Animal Internal Medicine, Faculty of Specialized Veterinary Science, Science and Research Branch, Islamic Azad University, Tehran, Iran. 3 Department of Food Hygiene and Quality Control, Epidemiology and Zoonoses Division of Faculty of Veterinary Medicine, University of Tehran ,Iran. . |
ABSTRACT
Objective: To assess B-mode and M-mode echocardiographic reference values in Domestic rabbits (Oryctolagus cuniculus). Animals: 100 healthy domestic rabbits. Procedures: M-mode and B-mode measurements of the LVFWd, AO, LA, LA/AO, LVFWs, LVIDd, LVIDs, IVSd, IVSs, and HR were determined. Results: Mean±SD heart rate during echocardiographic tests was 204.33±3.929 beats/min. Mean±SD measurements in diastole and systole for the interventricular septum thickness, left ventricular internal diameter, and left ventricular free wall thickness were 2.5496±0.125 mm and 3.4232±0.134 mm; 15.5428±0.579 mm and 10.9706±0.439 mm; and 2.355±0.0977 mm and 3.6119±0.155 mm, respectively. Mean ± SD left atrial-to-aortic diameter ratio was 1.2265 ±0.0202, and Mean ± SD for fractional shortening and ejection fraction were 29.6047±0.941% and 60.0756±1.328%, respectively. All echocardiographic parameters were studied separately in males and females and in different weights. Conclusions and Clinical Relevance: Echocardiographic reference values for non-anesthetized domestic rabbits are presented providing reference values for future studies. Most of the results were comparable to those reported in non-anesthetized rabbits and may offer a good alternative when this data is necessary.
Key Words: Echocardiography, Rabbit, Reference values, Oryctolagus cuniculus.
INTRODUCTION
Domestic rabbit (Oryctolagus cuniculus) is becoming gradually popular as a companion animal. The cardiac disease has been reported in pet rabbits [1, 2]. Echocardiography is a valuable method for diagnosing cardiovascular illness in small animals [3]. In addition to dogs and cats, rabbits are popular companion animals in the world with millions kept as pets. Nearly 60% of these rabbits are registered with a veterinary practice. The number of reported or anecdotal reports on congenital or acquired cardiac diseases is growing, which leads to a growing demand to perform echocardiography in pet rabbits as clinical cases. Reports of normal echocardiographic findings for comparison with potentially unhealthy rabbits are very limited, and most of them involve the description of particular echocardiographic parameters in small cohorts of young rabbits in a research setting. It has been utilized for cardiac imaging and assessment in experimental and clinical settings and has become an essential tool in the specialty of veterinary cardiology since it facilitates noninvasive measurement of cardiac structures. The results in healthy animals is crucial for the explanation of findings in clinical subjects. Values obtained from clinically normal animals by application of 2-dimensional (B-mode) and M-mode echocardiography have been described in a variety of animals, including dogs [4, 5], cats [6], hamsters [7], and birds [8], but, reference values for rabbits have not been published in Iran and many other countries. The goal of this investigation was to define reference values for echocardiographic M-mode and B-mode in healthy domestic rabbits in Iran.
MATERIALS AND METHODS
100 rabbits between 6 to 12 months of age without sedation or anesthesia were used in this study. Rabbits were free of signs of cardiovascular or respiratory tract ailment and were determined to be clinically normal according to a physical examination and radiology. For the right parasternal views, rabbits were placed in right lateral recumbency over a gap on the tabletop through which the ultrasound probe was brought from below and located on a shaved area on the cranial aspect of the lower portion of the right thoracic wall. The hair was cut in the subcostal portion of the abdominal wall for the subcostal apical 4-chamber view, which was obtained with rabbits positioned in dorsal recumbency [9]. Echocardiographic measurements were carried out from standard views. Transthoracic 2-dimensional (B-mode) and M-mode echocardiography were performed with a system that included B-Mode and M-Mode capabilities with a 9-MHz transducer. Calipers were utilized to measure structures to the nearest millimeter by means of a leading-edge–to–leading-edge technique based on accepted echocardiographic standards for rabbits. From the right parasternal short-axis view, 2-dimensional (B-mode) guided M-mode tracings were made just below the mitral valve at the level of the papillary muscles for examinations of the IVS, LVID, and LVFW in diastole and systole and left atrial diameters were evaluated at the level of the aortic valve. These measurements were performed from the leading edge of the first endocardial surface to the leading edge of the second endocardial surface. Assessments of LVID and IVS in diastole and systole, the thickness of the LVFW in diastole and systole, and the left atrial appendage and aortic diameters were extensively utilized for assessment of cardiac morphology. The echocardiographic values were determined for FS, ejection fraction (EF). An ultrasound system (ZONCARE Q9) with a phased array sector transducer of 7.5 MHz and a micro convex transducer of 9 MHZ were utilized for all of the echocardiographic examinations. Based on published standards [10], rabbits were located in right lateral recumbency and manually restrained without sedation. A complete B-mode and Motion-mode (M-Mode) exam was carried out with standard right parasternal long and short axis views [9, 11]. Standard cardiac wall and chamber thicknesses were then determined. Any suspected anomalies were subsequently scanned in numerous planes to guarantee that the heart was normal. Subjective comparisons of the left ventricle (LV), intraventricular septum (IVS) and right ventricle (RV) wall thicknesses to lumen size, as well as the right heart to left heart structures were made. Left atrial (LA) diameter and aortic root (Ao) were measured on M-mode views [12]. The overall appearance of the heart was also assessed accurately on the short axis images: round symmetrical LV circumference [13]. The left ventricular internal diameter in diastole was examined in B-mode and M-mode. M-mode measurements included left ventricular internal diameter at end-diastole (LVIDd) and end-systole (LVIDs), Ao at end-diastole, LA at end-systole, interventricular septal thickness at end-diastole (IVSd) and end-systole (IVSs), and left ventricular posterior wall thickness at end-diastole (LVFWd) and systole (LVFWs). The percent fractional shortening (%FS) was determined by the standard formula: LVIDd – LVIDs divided by LVIDd. The LA:Ao ratio was measured from M-mode measurements.
Statistical analyses
The data were stored in MS Excel and analyzed with the statistical software. Means and proportions of the different features (age, weight, and echocardiographic measurements) were determined. The normality of interval measured data within male and female groups was evaluated utilizing a Kolmogorov Smirnov test. Means and proportions were contrasted between male and female rabbits utilizing the appropriate two-sample tests (unpaired T-test, Mann Whitney). To explain the relationship between the different numeric (interval and score) parameters for age and body weight, a Spearman’s rank correlation test was utilized. P-values<0.05 were considered statistically significant.
RESULTS
50 rabbits (50 %) were female and 50 rabbits (50 %) were male. The mean age of all rabbits in the research was 9.08 months (ranged from 6 to 12 months). The mean age of female rabbits was not significantly less than that of the male. The mean weight of the female population was 2517.20 gr. The mean weight of males was significantly higher than that of females. The mean heart rate of the 50 female rabbits was 207.66 beats/min, which was significantly higher than the mean heart rate of the males (201 beats/min). All evaluations of echocardiographic dimensions are depicted in Table 1. The mean values of LA, LA:Ao and LVIDs of the male population were significantly higher than those of the female population. LA, Ao, LVIDd, and LVWFd differed significantly between male and female rabbits (Table 2).
Echocardiographic parameters such as the IVSs, IVSd, LVIDs, LVIDd, LVFWs, and LVFWd increased parallel to BW. LVFW was higher (p<0.05) in males than in females. It was revealed that fractional shortening (FS) and ejection fraction (EF) values reduced based on BW. It was also demonstrated that the left atrial dimension (LAD) and aortic root dimension (AOD) enhanced in association with the enhancement in BW; of these parameters, LAD and AOD were higher (p<0.05) in males than in females, and only the CA amplitude was statistically higher (p<0.05) in females than in males. All echocardiographic parameters for eight weights were investigated separately in this study (Table 2).
DISCUSSION
Domestic rabbit is a good model for cardiovascular research owing to its size, which makes surgical manipulation of the heart more practicable than in smaller animals; they are less expensive to procure and maintain than dogs, and the composition of rabbit myosin and the kinetics of calcium in the rabbit are comparable to those in human myocardium [14].
Pet rabbits can develop cardiovascular disease. Radiography, electrocardiography, and echocardiography are useful noninvasive diagnostic procedures that can be used in the evaluation of cardiac disease to provide a highly specific assessment of cardiac size, dysrhythmias, and internal structure and function (dynamics), respectively [3]. Measurements of the thickness of the LVFW in diastole and systole, IVS in systole and diastole, LVID in systole and diastole, and the left atrial appendage and aortic diameters are extensively utilized for assessment of cardiac morphology. The echocardiographic values determined for FS, ejection fraction, were utilized to assess systolic, and diastolic function.
The mean±SD heart rate of the rabbits in our research was 204.33 ±3.929 beats/min, a range that was lower than the range of mean heart rates (180 to 250 beats/min) previously reported for conscious rabbits [15]. Echocardiographic M-mode measurements described for dogs differ proportionally with body size (weight), which varies by breed [16]. The M-mode measurements reported for cats [17, 18], ponies, horses [19], ferrets [20], and chinchillas [21], however, do not vary with body size, probably because different breeds of these species are comparable in size. Although the bodyweight of rabbits in the present investigation varied from 2000 to 3250 gr, significant associations between body weight and echocardiographic measurements were noticed. Because there were significant changes in echocardiographic values within this range of body weights, the authors speculate that cardiac measurements do not enhance with improved weight after rabbits reach maturity. Values for the echocardiographic variables in this investigation can represent reference values for application in the echocardiographic examination of all domestic rabbits.
CONCLUSIONS:
Echocardiographic reference values for non-anesthetized domestic rabbits are presented providing reference values for future studies. Most of the results were comparable to those reported in non-anesthetized rabbits, and may offer a good alternative when this data is necessary.
Appendıces
Table 1: Comparison of echocardiographic parameters, age, weight and heart rate between healthy adult male and female rabbits examined.
|
|
Sex |
N |
Mean |
Std. Deviation |
Std. Error Mean |
P-value |
|
Body weight (gr) |
Male |
50 |
2663.20 |
273.604 |
38.693 |
|
|
Female |
50 |
2517.20 |
315.802 |
44.661 |
0.381 |
|
|
Heart rate |
Male |
50 |
201.00 |
(.352 |
2.878 |
|
|
Female |
50 |
207.66 |
19.579 |
2.769 |
0.007 |
|
|
LA mm) |
Male |
50 |
10.7754 |
1.654376 |
.233964 |
0.021 |
|
Female |
50 |
10.0252 |
1.869933 |
.264448 |
|
|
|
AO (mm) |
Male |
50 |
8.7752 |
1.04592 |
.14791 |
0.006 |
|
Female |
50 |
8.0970 |
1.25949 |
.17812 |
|
|
|
LA/AO |
Male |
50 |
1.2200 |
.09943 |
.01406 |
|
|
Female |
50 |
1.2330 |
.10835 |
.01532 |
0.475 |
|
|
LVIDd (mm) |
Male |
50 |
15.9890 |
2.81264 |
.39777 |
0.103 |
|
Female |
50 |
15.0966 |
3.08259 |
.43594 |
|
|
|
LVIDs (mm) |
Male |
50 |
11.4090 |
2.08494 |
.29485 |
0.06 |
|
Female |
50 |
10.5322 |
2.34959 |
.33228 |
|
|
|
LVFWd (mm) |
Male |
50 |
2.4956 |
.52592 |
.07438 |
0.004 |
|
Female |
50 |
2.2144 |
.43642 |
.06172 |
|
|
|
LVFWs(mm) |
Male |
50 |
3.8328 |
.77389 |
.10944 |
0.0008 |
|
Female |
50 |
3.3910 |
.76538 |
.10824 |
|
|
|
IVSd (mm) |
Male |
50 |
2.7078 |
.60289 |
.08526 |
0.007 |
|
Female |
50 |
2.3914 |
.64146 |
.09072 |
|
|
|
IVSs (mm) |
Male |
50 |
3.6224 |
.63876 |
.09033 |
0.003 |
|
Female |
50 |
3.2240 |
.68665 |
.09711 |
|
|
|
FS (percent) |
Male |
50 |
28.5774 |
4.76851 |
.67437 |
0.041 |
|
Female |
50 |
30.6320 |
4.70638 |
.66558 |
|
|
|
EF (percent) |
Male |
50 |
58.7536 |
6.88923 |
.97428 |
0.065 |
|
Female |
50 |
61.3976 |
6.53087 |
.92360 |
|
Table 2: Echocardiographic parameters, age, weight and heart rate in healthy adult male and female rabbits examined.
|
Body weight (gr) |
Heart rate |
LA(mm) |
AO(mm) |
LA/AO |
LVIDd (mm) |
LVIDs (mm) |
|
|
2000 - 2160 |
Mean |
222.60 |
8.24100 |
7.2700 |
1.1270 |
12.4230 |
8.6690 |
|
N |
10 |
10 |
10 |
10 |
10 |
10 |
|
|
Std. Deviation |
18.374 |
1.122452 |
.93824 |
.03234 |
1.78268 |
1.34918 |
|
|
Std. Error of Mean |
5.810 |
.354951 |
.29670 |
.01023 |
.56373 |
.42665 |
|
|
Minimum |
193 |
6.750 |
5.90 |
1.08 |
9.20 |
6.35 |
|
|
Maximum |
245 |
10.300 |
8.68 |
1.18 |
15.53 |
10.74 |
|
|
2161 - 2320 |
Mean |
209.46 |
8.44000 |
7.1692 |
1.1669 |
12.8008 |
8.5600 |
|
N |
13 |
13 |
13 |
13 |
13 |
13 |
|
|
Std. Deviation |
14.655 |
1.647387 |
.96183 |
.08864 |
2.60627 |
1.58414 |
|
|
Std. Error of Mean |
4.065 |
.456903 |
.26676 |
.02458 |
.72285 |
.43936 |
|
|
Minimum |
183 |
6.630 |
5.98 |
1.07 |
9.20 |
6.35 |
|
|
Maximum |
231 |
11.640 |
8.78 |
1.33 |
17.97 |
11.07 |
|
|
2321 - 2480 |
Mean |
215.85 |
9.70692 |
7.9462 |
1.2169 |
14.6923 |
10.4215 |
|
N |
13 |
13 |
13 |
13 |
13 |
13 |
|
|
Std. Deviation |
19.527 |
1.327481 |
.94853 |
.09911 |
2.87288 |
2.19636 |
|
|
Std. Error of Mean |
5.416 |
.368177 |
.26307 |
.02749 |
.79679 |
.60916 |
|
|
Minimum |
185 |
7.900 |
6.20 |
1.10 |
10.87 |
6.81 |
|
|
Maximum |
254 |
11.370 |
9.71 |
1.41 |
19.04 |
13.14 |
|
|
2481 - 2640 |
Mean |
207.78 |
10.56444 |
8.4350 |
1.2500 |
15.3417 |
11.2278 |
|
N |
18 |
18 |
18 |
18 |
18 |
18 |
|
|
Std. Deviation |
19.952 |
1.328313 |
.87405 |
.11386 |
2.63979 |
1.92911 |
|
|
Std. Error of Mean |
4.703 |
.313086 |
.20602 |
.02684 |
.62220 |
.45470 |
|
|
Minimum |
177 |
8.900 |
5.93 |
1.09 |
10.87 |
6.81 |
|
|
Maximum |
245 |
13.210 |
10.11 |
1.50 |
19.18 |
13.76 |
|
|
2641- 2800 |
Mean |
200.22 |
11.19481 |
9.0222 |
1.2385 |
16.7411 |
11.7515 |
|
N |
27 |
27 |
27 |
27 |
27 |
27 |
|
|
Std. Deviation |
12.801 |
1.296381 |
.95910 |
.06274 |
2.28652 |
1.69133 |
|
|
Std. Error of Mean |
2.464 |
.249489 |
.18458 |
.01207 |
.44004 |
.32550 |
|
|
Minimum |
181 |
8.890 |
6.92 |
1.13 |
11.71 |
8.81 |
|
|
Maximum |
230 |
13.460 |
10.22 |
1.36 |
19.86 |
14.92 |
|
|
2801 - 2960 |
Mean |
186.38 |
12.14500 |
9.7475 |
1.2462 |
18.5212 |
13.6462 |
|
N |
8 |
8 |
8 |
8 |
8 |
8 |
|
|
Std. Deviation |
19.661 |
.940167 |
.37724 |
.08749 |
.83297 |
.96411 |
|
|
Std. Error of Mean |
6.951 |
.332399 |
.13337 |
.03093 |
.29450 |
.34087 |
|
|
Minimum |
167 |
10.930 |
8.85 |
1.14 |
16.69 |
11.78 |
|
|
Maximum |
228 |
14.210 |
10.07 |
1.44 |
19.21 |
14.92 |
|
|
2961 - 3120 |
Mean |
190.57 |
11.96000 |
8.7771 |
1.3714 |
17.6343 |
12.0829 |
|
N |
7 |
7 |
7 |
7 |
7 |
7 |
|
|
Std. Deviation |
22.729 |
.359722 |
.93111 |
.15636 |
1.98705 |
1.80257 |
|
|
Std. Error of Mean |
8.591 |
.135962 |
.35192 |
.05910 |
.75103 |
.68131 |
|
|
Minimum |
169 |
11.280 |
7.84 |
1.13 |
13.89 |
8.83 |
|
|
Maximum |
238 |
12.480 |
9.91 |
1.52 |
19.08 |
13.43 |
|
|
3121 - 3280 |
Mean |
176.75 |
12.10250 |
9.8900 |
1.2200 |
18.2175 |
12.6175 |
|
N |
4 |
4 |
4 |
4 |
4 |
4 |
|
|
Std. Deviation |
6.898 |
.399614 |
.08756 |
.05416 |
1.51454 |
1.61550 |
|
|
Std. Error of Mean |
3.449 |
.199807 |
.04378 |
.02708 |
.75727 |
.80775 |
|
|
Minimum |
168 |
11.520 |
9.83 |
1.14 |
15.96 |
10.21 |
|
|
Maximum |
184 |
12.430 |
10.02 |
1.26 |
19.09 |
13.55 |
|
|
Total |
Mean |
204.33 |
10.40030 |
8.4361 |
1.2265 |
15.5428 |
10.9706 |
|
N |
100 |
100 |
100 |
100 |
100 |
100 |
|
|
Std. Deviation |
20.148 |
1.796509 |
1.20114 |
.10366 |
2.96982 |
2.25346 |
|
|
Std. Error of Mean |
2.015 |
.179651 |
.12011 |
.01037 |
.29698 |
.22535 |
|
|
Minimum |
167 |
6.630 |
5.90 |
1.07 |
9.20 |
6.35 |
|
|
Maximum |
254 |
14.210 |
10.22 |
1.52 |
19.86 |
14.92 |
|
|
Body weight (gr) |
LVFWd (mm) |
LVFWS (mm) |
IVSd (mm) |
IVSs (mm) |
FS (percent) |
EF (percent) |
|
|
2000 - 2160 |
Mean |
1.8650 |
2.8730 |
1.9760 |
2.7830 |
30.2800 |
61.2600 |
|
N |
10 |
10 |
10 |
10 |
10 |
10 |
|
|
Std. Deviation |
.37925 |
.57643 |
.63554 |
.72630 |
3.64655 |
5.10124 |
|
|
Std. Error of Mean |
.11993 |
.18228 |
.20098 |
.22968 |
1.15314 |
1.61315 |
|
|
Minimum |
1.61 |
2.40 |
1.47 |
2.16 |
25.60 |
54.60 |
|
|
Maximum |
2.90 |
4.01 |
2.92 |
3.91 |
36.30 |
69.40 |
|
|
2161 - 2320 |
Mean |
1.7662 |
2.6362 |
1.7554 |
2.5362 |
32.9769 |
64.9154 |
|
N |
13 |
13 |
13 |
13 |
13 |
13 |
|
|
Std. Deviation |
.17086 |
.36041 |
.40449 |
.39348 |
4.63953 |
6.41468 |
|
|
Std. Error of Mean |
.04739 |
.09996 |
.11218 |
.10913 |
1.28677 |
1.77911 |
|
|
Minimum |
1.58 |
2.25 |
1.40 |
2.11 |
21.30 |
48.30 |
|
|
Maximum |
2.14 |
3.58 |
2.55 |
3.27 |
38.90 |
72.70 |
|
|
2321 - 2480 |
Mean |
2.2600 |
3.4531 |
2.3738 |
3.3754 |
29.1615 |
59.5077 |
|
N |
13 |
13 |
13 |
13 |
13 |
13 |
|
|
Std. Deviation |
.39958 |
.64817 |
.56256 |
.56700 |
5.89527 |
8.38157 |
|
|
Std. Error of Mean |
.11082 |
.17977 |
.15603 |
.15726 |
1.63505 |
2.32463 |
|
|
Minimum |
1.70 |
2.25 |
1.66 |
2.21 |
19.80 |
45.70 |
|
|
Maximum |
2.97 |
4.22 |
3.40 |
4.20 |
37.40 |
70.80 |
|
|
2481 - 2640 |
Mean |
2.3967 |
3.5778 |
2.5889 |
3.4667 |
26.7278 |
56.0100 |
|
N |
18 |
18 |
18 |
18 |
18 |
18 |
|
|
Std. Deviation |
.37773 |
.65284 |
.53231 |
.54331 |
4.98926 |
7.14840 |
|
|
Std. Error of Mean |
.08903 |
.15387 |
.12547 |
.12806 |
1.17598 |
1.68490 |
|
|
Minimum |
1.78 |
2.21 |
1.59 |
2.15 |
19.80 |
45.70 |
|
|
Maximum |
2.97 |
4.65 |
3.42 |
4.35 |
37.40 |
70.80 |
|
|
2641- 2800 |
Mean |
2.4789 |
3.8911 |
2.7589 |
3.6148 |
29.9185 |
60.4326 |
|
N |
27 |
27 |
27 |
27 |
27 |
27 |
|
|
Std. Deviation |
.36014 |
.47287 |
.41980 |
.49357 |
4.19863 |
5.94091 |
|
|
Std. Error of Mean |
.06931 |
.09100 |
.08079 |
.09499 |
.80803 |
1.14333 |
|
|
Minimum |
1.79 |
2.55 |
1.98 |
2.01 |
20.20 |
46.20 |
|
|
Maximum |
2.94 |
4.55 |
3.29 |
4.15 |
35.90 |
68.90 |
|
|
2801 - 2960 |
Mean |
2.8600 |
4.3737 |
3.1663 |
4.1575 |
26.9625 |
55.6750 |
|
N |
8 |
8 |
8 |
8 |
8 |
8 |
|
|
Std. Deviation |
.42795 |
.85745 |
.27339 |
.28379 |
4.27215 |
5.00278 |
|
|
Std. Error of Mean |
.15130 |
.30316 |
.09666 |
.10033 |
1.51043 |
1.76875 |
|
|
Minimum |
2.02 |
2.46 |
2.71 |
3.86 |
21.10 |
47.70 |
|
|
Maximum |
3.52 |
5.35 |
3.66 |
4.75 |
34.20 |
60.20 |
|
|
2961 - 3120 |
Mean |
2.7743 |
4.3371 |
3.1029 |
3.9400 |
31.6529 |
63.3286 |
|
N |
7 |
7 |
7 |
7 |
7 |
7 |
|
|
Std. Deviation |
.40836 |
.59905 |
.11715 |
.33076 |
3.34991 |
4.52685 |
|
|
Std. Error of Mean |
.15435 |
.22642 |
.04428 |
.12501 |
1.26615 |
1.71099 |
|
|
Minimum |
2.15 |
3.10 |
2.87 |
3.21 |
28.00 |
58.20 |
|
|
Maximum |
3.54 |
5.02 |
3.25 |
4.21 |
36.40 |
69.60 |
|
|
3121 - 3280 |
Mean |
3.0350 |
4.6225 |
3.3450 |
4.2000 |
30.9250 |
62.2250 |
|
N |
4 |
4 |
4 |
4 |
4 |
4 |
|
|
Std. Deviation |
.45800 |
.30576 |
.29240 |
.12728 |
3.39939 |
4.60751 |
|
|
Std. Error of Mean |
.22900 |
.15288 |
.14620 |
.06364 |
1.69969 |
2.30376 |
|
|
Minimum |
2.69 |
4.20 |
3.15 |
4.08 |
29.00 |
59.60 |
|
|
Maximum |
3.71 |
4.93 |
3.78 |
4.35 |
36.00 |
69.10 |
|
|
Total |
Mean |
2.3550 |
3.6119 |
2.5496 |
3.4232 |
29.6047 |
60.0756 |
|
N |
100 |
100 |
100 |
100 |
100 |
100 |
|
|
Std. Deviation |
.50114 |
.79729 |
.63940 |
.68949 |
4.82531 |
6.80934 |
|
|
Std. Error of Mean |
.05011 |
.07973 |
.06394 |
.06895 |
.48253 |
.68093 |
|
|
Minimum |
1.58 |
2.21 |
1.40 |
2.01 |
19.80 |
45.70 |
|
|
Maximum |
3.71 |
5.35 |
3.78 |
4.75 |
38.90 |
72.70 |
|
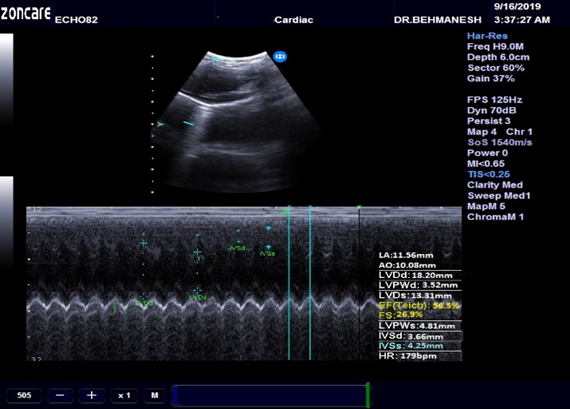
Figure 1. Echocardiographic long-axis section of the left ventricle at the four chamber level at both end-diastolic and end-systolic phases of the cardiac cycle.
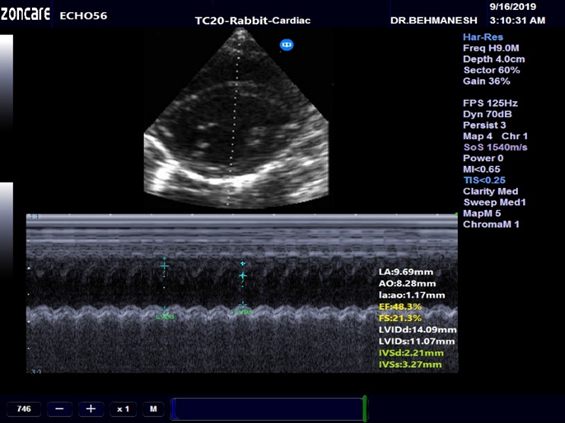
Figure 2. Echocardiographic short-axis section of the left ventricle at the papillary muscle level at both end-diastolic and end-systolic phases of the cardiac cycle.
Abbrevıatıons
Ao : aortic diameter
bpm :Beats per minute
FS :Fractional shortening
HR :Heart rate
IVSd :Interventricular septal wall thickness in diastole
IVSs :Interventricular septal wall thickness in systole
LA :Left atrium
LVIDd :Left ventricular internal diameter in diastole
LVIDs :Left ventricular internal diameter in systole
LVFWd :Left ventricular free wall in diastole
LVFWs :Left ventricular free wall in systole.
REFERENCES