International Journal of Pharmaceutical and Phytopharmacological Research
ISSN (Print): 2250-1029
ISSN (Online): 2249-6084
|
Effects of sulfur foliar application on the yield, yield components, and contents of oil and protein in different sesame cultivars in the south of Iran
Ruhollah Moradi1, Mahmoud Dejam2*, Mahdi Madandoust3, Farhad Mohajeri2 |
|
1Ph.D. student in Agriculture, Islamic Azad University, Fasa Branch, Iran. 2 Assistant Professor, Department of Agriculture, Islamic Azad University, Fasa Branch, Iran. 3 Associate Professor, Department of Agriculture, Islamic Azad University, Fasa Branch, Iran. |
ABSTRACT
Sulfur plays an important role in determining the grain yield and quality of oilseed crops. However, little is known about the effect of sulfur foliar application on the yield, yield components, and oil content of sesame genotypes. Therefore, a two-year field factorial experiment with a basic complete randomized block design was conducted in Fasa city during 2017-2018. The effects of sulfur foliar application at five concentrations of S1, S2, S3, S4, and S5 as 0, 1, 2, 4, and 8 ml, respectively (0, 300, 600, 1200, and 2400 ml of liquid sulfur/ha) were examined on endemic and non-native sesame cultivars, namely C1: Darab 1, C2: local Fasa, C3: Iraqi, C4: Tak-Par Dashtestan, and C5: Shesh-Par Borazjan. Treatments with the concentrations of 6 and 8 ml of the sulfur foliar application without statistically significant differences with each other were superior to the other treatments in terms of such traits like the number of capsules per plant, thousand-grain weight (TGW), plant dry weight (PDW), grain yield (GY), harvest index (HI), and grain oil content. The highest number of seeds per capsule was obtained from a concentration of 8 ml sulfur foliar application. The results showed that all cultivars reacted to the increased sulfur levels. The highest GY and number of capsules per plant belonged to C1, C4, and C5, with C4 and C2 containing the highest contents of grain oil and protein, respectively. The interaction of C5 and a concentration of 8 ml sulfur spraying led to the highest yield, the number of capsules per plant, TGW, PDW, and HI. Positive and significant correlations were obtained among GY with the number of capsules per plant (r = 0.97**), HI (r = 0.91**), TGW (r = 0.85**), and grains per capsule (0.55*). It can, therefore, be concluded that the number of capsules per plant and TGW have greater effects on increasing the GY of sesame than the other yield components. The percentages of grain oil and protein had a high negative and significant relationship (r = −0.88**) and the percentage of grain protein decreased with increasing the percentage of oil. In this study, the treatments with concentrations of 6 and 8 ml of liquid sulfur and Shesh-Per Dashtestan cultivar were superior to the other treatments in terms of increasing GY per unit area.
Key Words: sesame, oil percentage, yield.
INTRODUCTION
According to the FAO report, the area under sesame cultivation has increased worldwide during the last 20 years, and reached about 9.99 million hectares with a production of about 5.5 million tons in 2017. In the same years (2017-18), the area under cultivation and the amount of sesame production in Iran were estimated at 30,017 hectares and 30,649 tons, respectively. The highest areas under sesame cultivation belong to the southern region of Kerman, Fars, and Khuzestan provinces.
Sesame is a plant native to arid and semi-arid regions of the world. Since ancient times, sesame has commonly been cultivated in Iran and such features as drought tolerance, familiarity of farmers with its cultivation, its possible cultivation after harvesting wheat and barley in tropical regions, and high quantity and quality of its oil have led to paying attention to this plant. Sesame (Sesamum indicum L.) is one of the oldest oilseeds [1] and is widely used in food and medicine production due to its quality oil, protein, and antioxidants [2]. This plant is endemic to Iran and is of interest to farmers due to its unique characteristics and the possibility of second cultivation after wheat in arid and semi-arid regions.
Sesame is of interest as one of the most important oily plants due to its ease of extraction, high stability of its oil, and drought tolerance. Sesame oil belongs to the group of oleic-linoleic acids. This oil contains less than 15% of saturated fatty acids, most of which are palmitic and stearic, and unsaturated fatty acids comprise more than 85% of the total fatty acid content. Oleic and linoleic acids constitute more than 80% of the total fatty acids in sesame oil [3].
Sulfur is the fourth essential element after nitrogen, phosphorus, and potassium, and mainly functions in plants in the synthesis of sulfur-containing amino acids (e.g. methionine and cysteine), chlorophyll formation, activation of protein-degrading enzymes, participation in biotin structures, and activation of ATP sulfurylase [4]. Sulfur is also a constituent of coenzyme A, which produces acetyl coenzyme A once combined with acetic acid, and is important in lipid metabolism [5].
Adequate application of sulfur in different sources has been reported to improve GY and related components [6], oil, and protein content [7] in sesame. Sulfur deficiency negatively affects the growth and maturation stages of the crop [8] and the oil quality of oilseeds [9]. Oilseeds need higher amounts of sulfur than cereals because this element is very effective in pod formation and its deficiency causes the fall of pods or production of infertile pods. In general, an optimal supply of sulfur leads to a significant increase in grain yield [6] and seed quality by increasing oleic acid content in oilseeds [7]. For optimal sesame GY, therefore, adequate amounts of sulfur are needed in the vegetative stages [9].
Sesame is typically grown in arid to semiarid areas, where the amount and pattern of rainfall are variable from planting to harvest. Severe environmental conditions, in particular drought, may affect the crop during the reproductive stage, ultimately reducing crop yield and seed quality. At present, drought-sensitive cultivars are replaced with drought-resistant ones aiming at increasing GY. Extreme environmental conditions in the reproductive stage reduce crop yields [10] though suitable crop species can reduce the risks of climate change in prevailing environmental conditions [11]. The application of sulfur considerably increases the accumulation of biomass in crops by increasing their ability in coping with drought conditions [12].
The first report on leaf nutrient uptake was published in 1844, after which Mayer and Bohm reviewed past results. Two professors at the Horticulture Department, Michigan University, examined the transfer of radioactive isotopes of P and K and proved that plants were able to absorb nutrients through the leaves and aerial organs and that nutrients were transferred about 30 cm within an hour in organs of some plant genera [13]. Their results suggested that the success rate of nutrient uptake through foliar fertilization was about 95% while it was very variable (about 10%) in the root uptake method depending on the chemical and physical conditions of the soil. Soil acidity is a limiting factor in the absorption of nutrients because elements can be absorbed by plants only in a certain pH range. Since most agricultural soils in Iran are alkaline, there are always many problems, such as the stabilization of elements, for which the use of the foliar application is the only effective method to compensate for nutrient deficiencies [14].
In conditions of environmental (biotic) and extra-environmental (abiotic) stresses such as frost, high temperature, salinity, drought, pruning, pesticide consumption, etc., the plant loses the ability to absorb nutrients through the roots due to decreased root activity and foliar fertilization is the most effective method. Plant nutrition through the roots travels a long path in the plant to reach the leaves and fruits, while in the foliar application, the nutrients needed by the plant rapidly enter the phloem of the plant and reach the target sites. In fact, foliar application is a crosscut for plant nutrition [15].
Foliar spraying is highly effective for elements with low mobility in soil (phosphorus, potassium, and calcium) and those with low mobility in plants (calcium, magnesium, sulfur, barium, iron, manganese, and zinc) because these elements are always observed to be deficient in plants [16].
The sulfur requirements of oilseeds are higher than those of root crops, cereals, and legumes [17]. The deficiency of this element was also observed in crops, particularly oilseeds due to reduced sulfur emissions to the atmosphere and the use of sulfur-free mineral fertilizers [18, 19]. Plants absorb sulfur in sulfate form through their root system and transfer it into chloroplasts in leaf cells, where sulfate is reduced to sulfide and converted into organic compounds [20].
The use of sulfur fertilizers may improve the yield and quality of crops [21]. Foliar application of sulfur increases GY and the polymerization content of grain protein, which in turn significantly improves the dough mixing property [22]. In experiments with increasing sulfur doses for winter wheat, no significant differences were observed in nitrogen and sulfur contents and ratios in the flag leaf stage [23]. The amount of sulfur in winter wheat grain, determined by a fluorescent spectrometer, ranged from 1.74 to 2.35 mg S/kg. It was concluded that the use of sulfur in the highest amount of nitrogen fertilizer led to an increased amount of sulfur from 0.98 to 1.78 mg S/kg in wheat grain [24].
In recent years, sulfur has been one of the main limiting elements for the production of oilseeds owing to its large deficiency [25]. A study showed a significant reaction of safflower to sulfur fertilizer [26]. Sulfur consumption was also reported to be very beneficial in some crop rotations in oilseeds [27].
However, sesame has received less attention than other products for reasons such as low yield, disease susceptibility, unlimited growth, and blooming of capsules and has even become a forgotten plant. Endemic populations are of special importance due to their ability in maintaining survival for prolonged years and good adaptation to the climatic conditions of the region; these can be used as a valuable genetic resource in breeding new cultivars if they contain suitable traits [28]. GY in crops is a special trait strongly influenced by its components, thus knowledge of the role and impact of these components on the yield and understanding their interrelationships are necessary for breeding and selection operations [29].
One of the most important methods to increase agricultural production in crop management programs is to increase the efficiency of fertilizer use. To achieve this goal, the optimum amount of fertilizer application for individual crops should be considered based on plant nutritional needs during the growing season and nutrient contents in soil and plants. The morphological and physiological characteristics of plants are often affected by their accessibility to fertilizer sources, in particular trace elements. Considering the effect of sulfur fertilizer on the quality traits of oil products and the higher foliar application efficiency of elements than the soil method of fertilizer application, this study aimed to investigate the effects of sulfur fertilizer as a foliar application at different levels on quantitative and qualitative traits and sulfur use efficiency in sesame.
METHODS
This research was conducted in 2018 on rural farms located in the suburbs of Fasa city (53.63°, N 29.09° E, and 1450 m above sea level) in a factorial experiment with a randomized complete block design with two factors and three replications. Before land preparation, the field soil was sampled using an auger at two depths of 0-15 and 15-30 cm to determine the physicochemical properties of the soil. Experimental treatments consisted of five different sesame genotypes (Darab I, local Fasa, Iraqi, Tak-Par Dashtestan, and Shesh-Par Borazjan) and sulfur spraying at levels of 0 (spraying with pure water), 1, 2, 4, and 8 per thousand (spraying with liquid sulfur). Sulfur was sprayed by a back sprayer with calibration of 300 L/ha and, based on this, the amounts of consumed liquid sulfur were zero, 300, 600, 1200, and 2400 ml per hectare, respectively.
Each plot consisted of six planting lines with a distance and length of 75 cm and 6 m, respectively. An amount of 150 kg of pure nitrogen per hectare was used from the urea source in all plots, and all sesame cultivation operations were carried out according to conventional methods. After ripening, the sesame crop was harvested by hand with margin removal and GY per hectare was calculated based on the moisture content of 12%. The effects of experimental treatments were investigated on GY, oil content and yield, grain protein, grain fatty acid profile. The percentages of oil and protein were measured by Soxhlet and inframatic [30] methods, respectively. The 1000-SW was determined using a precise scale and the average weight of five samples was considered TGW per plot.
Experimental data were subjected to analysis of variance (ANOVA) using SAS statistical program and mean values were compared with Duncan’s test at 5% probability level.
RESULTS
According to meteorological statistics, maximum and minimum temperatures in the studied months were in August (40.3 and 41 °C) and in November (9 and 7.9 ° C) in 2018 and 2019, respectively (Figure 1). Total rainfall in the whole growing season was 11.9 and 31.7 mm in 2018 and 2019, respectively, all of which occurred in November and rainfall was zero in other months of the crop growth.
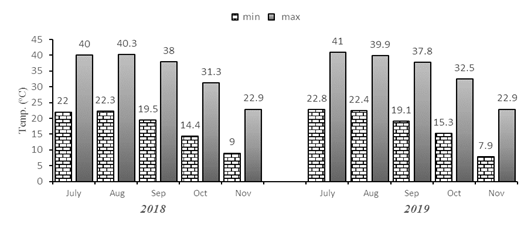
Fig. 1. Average minimum and maximum temperatures in the studied months
The results of the physicochemical analysis of the studied farm soil in the experimental years are shown in Table 1. The farm soil was without salinity, with alkaline pH, low organic C, moderate to good P and K, appropriate trace elements (Fe, Zn, Mn, and Cu), and loamy texture. Based on these results, there was no need to use potash and phosphorus fertilizers and foliar application of trace elements due to the appropriate levels of these elements(Table 1).
Table 1. Results of physicochemical analysis of experimental farm soil before the experiment
|
CLAY |
SILT |
SAND |
Cu |
Mn |
Zn |
Fe |
K |
P |
N |
OC |
pH |
Ec |
Year |
|
|
% |
PPM |
% |
|
dS.m-1 |
||||||||||
|
23.3 |
45.1 |
31.6 |
1.52 |
19.75 |
1.53 |
7.2 |
449 |
15.4 |
0.02 |
0.44 |
7.52 |
2.5 |
2018 |
|
|
23.8 |
43.2 |
33 |
1.50 |
19.8 |
1.4 |
7.1 |
438 |
13.4 |
0.01 |
0.46 |
7.6 |
3 |
2019 |
|
According to ANOVA results, the effect of year was not significant on all the traits, meaning that the two crop years had a similar effect on these traits; in other words, no significant changes occurred in the amounts of these traits in both years. The interactions of cultivar × year and sulfur × year were not significant for most of the traits, indicating that different cultivars showed the same reactions in both years(Table2). As such, the mean changes in most traits in the second experimental year were non-significant compared with the first year. This can be attributed to the lack of significant differences in the temperature, particularly at the early growing season in both experimental years and relatively similar soil conditions. These resulted in uniform germination and proper establishment of seedlings in both years, which created ideal conditions for creating a good field with high yield by performing appropriate photosynthesis (Table 2).
Based on the studied indices, the interaction of the year had no significant effects on most of the measured traits. ANOVA revealed a significant effect of cultivar on plant height, but other indices had no significant effects on the plant height. Significant independent effects of cultivar, the amounts of sulfur consumption, and the interaction of these two indices were observed on other measured traits (Table 2).
The results of matched ANOVA (Table 2) indicated that the effect of sulfur was significant on all the traits measured in sesame cultivars, except on the plant height. Several researchers reported that cultivars and varieties of sesame responded differently to sulfur fertilizer in terms of such traits as yield components, oil concentrations, and grain protein [31, 32].
Table 2. Summary of a 2-year compound ANOVA for Plant height(P.H.), Capsule length (C.L.), Capsule width (C.W.), Total Weight of 20 capsules (T.C.W.), thousand-grain weight (T.G.W), Grain yield (G.Y.), Plant dry weigh (P.D.W), and Harvest index (H.I) in different cultivars and sulfur spraying levels
|
|
|
Mean of Squares |
|||||||
|
S.O.V. |
df |
P.H. |
C.L. |
C.W. |
T.C.W |
T.G.W |
G.Y. |
P.D.W. |
H.I. |
|
Year (Y) |
1 |
10105.69ns |
5.56 ns |
0.512 ns |
2.41 ns |
2.13 ns |
1130757.71 ns |
177607.05 ns |
771.47 ns |
|
Rep. × Y |
4 |
307.56** |
0.66 ns |
0.089 ns |
11.01 ns |
9.46 ns |
7068460.01 ns |
80525085.40 ns |
124.51 ns |
|
Cultivar (C) |
4 |
1287.74** |
0.09** |
0.025** |
4.16** |
2.76** |
5760789.05** |
55892992.07** |
125.55** |
|
C × Y |
4 |
31.53ns |
0.05 ns |
0.001 ns |
0.12 ns |
0.01 ns |
106854.78 ns |
2630229.18** |
0.38 ns |
|
Sulfur (S) level |
4 |
8.01ns |
0.05** |
0.021** |
2.24** |
3.81** |
3963420.04** |
64243805.23 ** |
205.45** |
|
S×Y |
4 |
4.84ns |
0.00 ns |
0.001 ns |
0.01 ns |
0.02 ns |
13035.80 ns |
622.54 ns |
5.06 ns |
|
V× S |
16 |
3.45ns |
0.03** |
0.003** |
0.01** |
0.13** |
96362.94** |
283721.72** |
11.17** |
|
V×S×Y |
16 |
2.86ns |
0.00 ns |
0.001 ns |
0.00 ns |
0.00 ns |
4180.53 ns |
9635.27 ns |
0.40 ns |
|
Error |
96 |
14.06 |
0.01 |
0.003 |
0.07 |
0.04 |
46812.58 |
324658.34 |
1.92 |
|
CV (%) |
|
5.13 |
14.12 |
10.29 |
14.42 |
10.85 |
10.9 |
5.2 |
9.5 |
Table 3. Comparison of the mean values of traits measured in sesame cultivars and different amounts of sulfur
|
|
P.H. |
C.L. |
C.P.P. |
G.P.C. |
T.G.W |
P.D.W. |
G.Y. |
H.I. |
|
Cultivar |
|
|
|
|
|
|
||
|
C1 |
68.48c |
2.44a |
23.10ab |
75.69a |
1.78b |
11979.70a |
2240.99 a |
14.72 b |
|
C2 |
70.26c |
2.36b |
21.06b |
61.17c |
1.59b |
10786.96b |
1684.63 b |
12.53 b |
|
C3 |
82.88a |
2.35c |
15.21c |
54.83d |
1.59b |
8461.88c |
1369.14 b |
12.79 b |
|
C4 |
67.2c |
2.35d |
22.82ab |
58.65cd |
2.12a |
11557.0 ab |
2167.55 a |
14.86b |
|
C5 |
76.54b |
2.28e |
25.94a |
66.09b |
2.25a |
10978.41b |
2432.14 a |
17.62a |
|
Sulfur rate |
|
|
|
|
|
|
||
|
S1 |
|
2.33 a |
18.18b |
62.41c |
1.57b |
9612.08b |
1669.33b |
12.31b |
|
S2 |
|
2.34 b |
18.27b |
62.71bc |
1.60b |
9696.52b |
1678.131b |
12.24b |
|
S3 |
|
2.34 c |
19.65b |
62.85bc |
1.66b |
9746.04b |
1802.11b |
13.30b |
|
S4 |
|
2.35 d |
25.59a |
63.04b |
2.17a |
12313.32a |
2348.31a |
17.21a |
|
S5 |
|
2.43 e |
26.44a |
65.42a |
2.33a |
12395.99a |
2396.60a |
17.45a |
Means with at least one similar letter are not statistically different (Duncan 5%)
Cultivars include C1: Darab 1, C2: Local Fasa, C3: Iraqi, C4: Tak-Par Dashtestan, C5: Shesh-Par Borazjan. Sulfur foliar application at levels of S1: zero, S2: 2, S3: 4, S4: 6, S5: 8 ml/L of liquid sulfur
Sesame cultivars had significant effects on all the studied traits. The yields of crop cultivars have been compared by many researchers, indicating that plant traits depend on its cultivar and genetics. Any cultivar that has high genetic traits of grain production and yield per unit is more successful in this regard. Hafiz Saad et al. (2015) reported that different cultivars of sesame were different significantly in terms of grain yield, yield components, and other traits [33]. Lazemi et al. (2007) also found significant differences in yield and its components between different cultivars of sesame [34].
Significant effects of cultivar were observed on such traits as the number of capsules per plant, number of grains per capsule, and TGW. In addition, the interaction of sulfur × cultivar had a significant effect on all other studied traits, except on the plant height. It is, therefore, speculated that the effect of sulfur on the number of shoots is more than that on the plant height, thereby increasing the number of capsules per plant. It also prevents the increase of plant elongation and consequently plant lodging and its adverse effects on sesame GY. The increased reproductive versus vegetative growth led to significant simple and interaction effects of sulfur and cultivar on the grain HI (Table 3).
The results of comparing mean values of data indicated that the highest number of branches and the most important yield components such as the number of capsules per plant, TGW, PDW, and GY per unit area were obtained due to foliar application of liquid sulfur at 8 ml (Table 3). Sulfur was reported to increase the ratio of reproductive organs to total plant dry matter, and sulfur deficiency was found to stop the growth of reproductive organs, even leading to infertility of pods [35, 36].
Increasing the amount of sulfur from 0 to 1 ml resulted in an increased percentage of grain oil and protein by 6.1 and 1.03%, respectively. Grain oil and protein content were affected significantly by the cultivars. The highest percentage of oil was obtained from Tak-Par Dashtestan among the studied cultivars (Figure 2). The grain protein content in Fasa local cultivar was placed at the highest level in the statistical group relative to those of the other cultivars (Figure 2). Improvement of oil content is very important in sesame production [37]. This compound is significantly influenced by genetic, climatic, and agronomic factors and is very different in terms of diversity. Species with shorter growth periods contain more oil than those with longer periods [28].
On the other hand, a high correlation between GY and DW suggests that increasing DW along with increasing HI to achieve a high GY is necessary for the cultivation of oilseeds (Table 6). Other researchers found that cultivars with higher GY had greater HI and that the improvement of GY in these plants in the future would depend on increasing HI [38, 39]. Our results showed that the highest and lowest height belonged to Iraqi and Fasa local cultivars, respectively. The highest number of capsules per plant, TGW, GY, and HI belonged to Shesh-Par Borazjan cultivar, and Darab 1 contained the highest number of seeds per capsule and capsule length(Table3). These findings indicate the presence of genetic differences between sesame cultivars and consequently the greater capability of Seshpar Borazjan and Darab 1 cultivars in the use of growth resources for increasing GY per unit area [32]. Different results were reported about the association between GY and its components. GY can be most related to TGW [40] or the number of capsules per plant [41], which confirmed the present observations.
According to a comparison of mean interactions, the interaction of Iraqi cultivar × a sulfur level of 4 ml resulted in the highest plant height (84 cm). The interaction of this cultivar with foliar application of sulfur at levels of 6 and 8 ml was placed in a single group without a significant difference with a superior treatment(Table4). The highest TGW, GY, and HI were obtained from the interaction of Shesh-Par Borazjan cultivar with foliar application of liquid sulfur at 6 and 8 ml. Increased levels of yield, its components, and the measured traits, such as capsule length, number of capsules, and number of seeds per capsule, TGW, PDW, and HI were observed in all cultivars of sesame with increasing the amount of liquid sulfur spraying from 0 to 0.8 ml (Table 4). However, the trend of changes in the yield and its components was similar due to increasing amounts of sulfur, indicating a similar reaction of yield and yield components of sesame grains to changes in sulfur content in the plant, which is in line with Ibrahim (2014) [42]. The interaction between the studied factors was not significant in the grain oil and protein contents (Table 5).
Table 4. Comparison of the average interactions of sesame cultivars and sulfur foliar application levels
|
Treatment |
P.H. (cm) |
C.L. (cm) |
C.P.P. |
G.P.C. |
T.G.W (g) |
P.D.W. (kg/ha) |
G.Y. (kg/ha) |
H.I. (%) |
|||||||||
|
C1 |
s1 |
67.4 |
h |
2.35 |
ef |
20.12 |
fg |
72.79 |
b |
1.53 |
fgh |
10608.0 |
cd |
1951.38 |
c |
13.25 |
cde |
|
C1 |
s2 |
68.3 |
gh |
2.37 |
bcde |
20.29 |
fg |
73.35 |
b |
1.56 |
e-h |
10812.0 |
c |
1967.84 |
c |
12.96 |
de |
|
C1 |
s3 |
68.3 |
gh |
2.38 |
bc |
20.35 |
fg |
73.63 |
b |
1.57 |
e-h |
10836.5 |
c |
1974.11 |
c |
12.89 |
de |
|
C1 |
s4 |
69.2 |
fgh |
2.38 |
b |
27.28 |
bc |
73.63 |
b |
2.11 |
bc |
13770.0 |
a |
2646.00 |
a |
17.21 |
b |
|
C1 |
s5 |
69.2 |
fgh |
2.74 |
a |
27.48 |
bc |
85.06 |
a |
2.12 |
bc |
13872.0 |
a |
2665.60 |
a |
17.29 |
b |
|
C2 |
s1 |
69.8 |
efgh |
2.34 |
fghi |
18.72 |
gh |
60.89 |
ef |
1.36 |
h |
9572.8 |
d |
1497.23 |
de |
11.42 |
e |
|
C2 |
s2 |
69.8 |
efgh |
2.35 |
ef |
18.80 |
gh |
61.13 |
def |
1.37 |
h |
9592.0 |
d |
1504.00 |
de |
11.43 |
e |
|
C2 |
s3 |
70.7 |
efgh |
2.35 |
ef |
18.89 |
gh |
61.13 |
def |
1.38 |
h |
9680.0 |
d |
1511.52 |
de |
11.38 |
e |
|
C2 |
s4 |
70.3 |
efgh |
2.36 |
bcdef |
24.21 |
cdef |
61.36 |
def |
1.87 |
c-f |
12500.0 |
b |
1936.40 |
c |
14.12 |
cd |
|
C2 |
s5 |
70.7 |
efgh |
2.36 |
bcdef |
24.68 |
cde |
61.36 |
def |
1.97 |
bcd |
12590.0 |
b |
1974.00 |
c |
14.29 |
cd |
|
C3 |
s1 |
82.2 |
abc |
2.27 |
k |
9.38 |
i |
54.53 |
g |
1.35 |
h |
7520.0 |
e |
844.40 |
f |
8.08 |
f |
|
C3 |
s2 |
82.2 |
abc |
2.27 |
k |
9.42 |
i |
54.53 |
g |
1.41 |
h |
7677.9 |
e |
847.93 |
f |
7.94 |
f |
|
C3 |
s3 |
84 |
a |
2.29 |
jk |
15.81 |
h |
54.96 |
g |
1.47 |
gh |
7700.5 |
e |
1422.89 |
e |
13.31 |
cde |
|
C3 |
s4 |
82.4 |
abc |
2.29 |
jk |
20.63 |
efg |
54.96 |
g |
1.87 |
c-f |
9635.0 |
d |
1856.40 |
cd |
17.35 |
b |
|
C3 |
s5 |
83.6 |
ab |
2.30 |
j |
20.82 |
efg |
55.18 |
g |
1.87 |
c-f |
9776.0 |
cd |
1874.08 |
cd |
17.26 |
b |
|
C4 |
s1 |
66.7 |
h |
2.33 |
g i |
19.89 |
g |
58.15 |
fg |
1.69 |
d-h |
10414.3 |
cd |
1889.54 |
cd |
13.07 |
de |
|
C4 |
s2 |
68.5 |
gh |
2.34 |
fgh |
19.97 |
fg |
58.60 |
fg |
1.71 |
defgh |
10433.6 |
cd |
1897.28 |
cd |
13.10 |
de |
|
C4 |
s3 |
66.9 |
h |
2.34 |
fg |
20.22 |
fg |
58.60 |
fg |
1.84 |
cdefg |
10521.9 |
cd |
1920.51 |
c |
13.15 |
de |
|
C4 |
s4 |
66.1 |
h |
2.35 |
ef |
26.59 |
bcd |
58.83 |
fg |
2.33 |
b |
13172.5 |
ab |
2526.48 |
ab |
17.28 |
b |
|
C4 |
s5 |
67.8 |
h |
2.36 |
bcdef |
27.41 |
bc |
59.05 |
fg |
3.01 |
a |
13242.8 |
ab |
2603.92 |
a |
17.71 |
b |
|
C5 |
s1 |
75.1 |
defg |
2.35 |
ef |
22.78 |
defg |
65.69 |
cde |
1.93 |
cde |
9945.3 |
cd |
2164.12 |
bc |
15.73 |
bc |
|
C5 |
s2 |
76 |
cdef |
2.36 |
b def |
22.88 |
defg |
65.94 |
cd |
1.94 |
cde |
9967.1 |
cd |
2173.60 |
bc |
15.77 |
bc |
|
C5 |
s3 |
76.9 |
bcde |
2.36 |
b def |
22.96 |
defg |
65.94 |
cd |
2.02 |
bcd |
9991.3 |
cd |
2181.50 |
bc |
15.79 |
bc |
|
C5 |
s4 |
78.1 |
abcd |
2.37 |
bcd |
29.22 |
ab |
66.44 |
c |
2.68 |
a |
12489.1 |
b |
2776.28 |
a |
20.09 |
a |
|
C5 |
s5 |
76.6 |
cde |
2.37 |
bcd |
31.84 |
a |
66.44 |
c |
2.68 |
a |
12499.2 |
b |
2865.20 |
a |
20.72 |
a |
Means with at least one similar letter are not different statistically (Duncan 5%).
Cultivars include C1: Darab 1, C2: Local Fasa, C3: Iraqi, C4: Tak-Par Dashtestan, C5: Shesh-Par Borazjan. Sulfur foliar application at levels of S1: 0, S2: 2, S3: 4, S4: 6, S5: 8 ml/L of liquid sulfur
Correlation coefficients (Table 6) between the measured traits revealed that positive and significant correlations between GY with the number of capsules per plant, TGW, and the number of grains per capsule, respectively, which can be considered a good indicator for breeding high-yield sesame cultivars. PDW and HI also had positive and significant correlations with sesame yield in the present study. In this experiment, the number of capsules per plant was one of the important factors in increasing yield, completely corresponds to that of Silva et al. (2016) [41].
Capsule length was positively and significantly correlated with the number of grains per capsule; in other words, increasing the capsule length provides more space for the development of more seeds. Capsule length was also significantly correlated with PDW and yield and no significant correlations were observed with the other traits. There was a positive and significant correlation of TGW with the number of capsules, but it had a negative and non-significant relationship with the number of seeds per capsule, indicating the presence of a compensatory mechanism between GY components in sesame, thus the increased number of capsules in the plant led to increased TGW and decreased number of grains per capsule (table 6).
Basalma (2008) reported that the number of pods per sesame stalk showed a positive and significant correlation with the number of grains per pod, but a significant correlation was observed between the number of grains per pod and TGW [43]. Other researchers reported the presence of a compensatory mechanism between the GY components of sesame [44, 45].
In another study, sesame GY was positively and significantly correlated with the number of capsules per plant, TGW, and PDW, and described an important role of the number of capsules per plant in improving GY per unit area [46]. In this study, the grain oil content had positive and significant relationships with the yield and TGW (table 6). Basalma (2008) observed a positive and significant correlation between GY and oil yield in sesame [43]. Contrary to other reports, however, there was a negative and significant correlation between GY and grain oil content. The oil and protein contents in sesame grains are an essential component in determining the nutritional quality of sesame and its market value. In the present study, higher use of sulfur increased the oil content but decreased the protein content (Figures 3 and 4). Similarly, increased oil and decreased protein contents have been reported rapeseed [47]. The increased grain oil content due to an increase in sulfur may be related to the use of stored carbohydrates for oil production [50].
There was also a significant negative relationship between grain oil and protein contents (Figure 4); such a relationship was reported by many researchers [7]. Physiologically, a negative correlation between oil and protein contents may be attributed to more carbohydrates needed for protein synthesis than that for oil synthesis [48, 49].
CONCLUSION
Overall, it can be concluded that the application of sulfur and its foliar application is one of the important priorities of agriculture, in particular sesame cultivation, which can have a substantial contribution to the achievement of potential yield and increasing the quantity and quality of sesame plant. Based on the findings of this study, the use of sulfur solution at 8 ml is recommended to increase sesame yield in Fasa and similar regions. According to our observations, Shesh-Par Borazjan, Darab 1, and Tak-Par Dashtestan, with the highest yield among the studied cultivars, can be recommended for planting in the study area with similar conditions.
Table 5. Summary of ANOVA for oil (O, %) and protein (P, %) contents in different cultivars and sulfur spraying levels
|
|
|
Mean of squares |
|
|
S.O.V. |
df |
O% |
P% |
|
Year (Y) |
1 |
2861.76ns |
32.85ns |
|
Rep. × Y |
4 |
481.73ns |
73.47ns |
|
Cultivar (C) |
4 |
1761.78** |
858.00** |
|
C × Y |
4 |
17.62ns |
0.77ns |
|
Sulfur rate (S) |
4 |
138.19** |
43.90** |
|
S × Y |
4 |
1.38ns |
0.11ns |
|
C × S |
16 |
4.96ns |
0.84ns |
|
C × S × Y |
16 |
0.05ns |
0.21ns |
|
Error |
96 |
0.54 |
0.53 |
|
CV (%) |
|
8.2 |
11.03 |
* and **: Significant at 5% and 1% probability levels, respectively; ns: non-significant
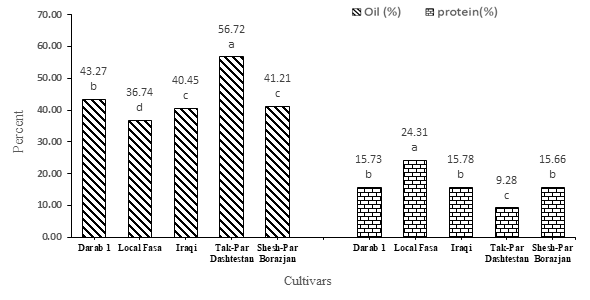
Fig. 2. Percentages of oil and protein in the studied cultivars
Means with at least one similar letter in each chart are not different statistically (Duncan 5%).
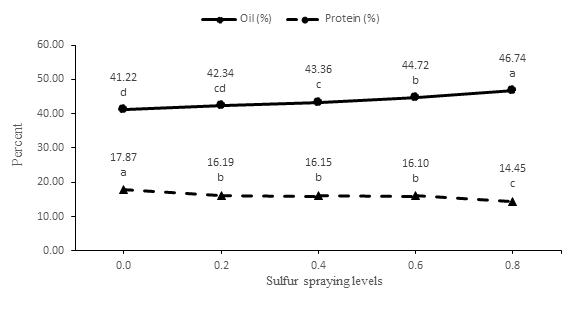
Fig. 3. Changes in the percentages of oil and protein at different levels of sulfur foliar application
Means with at least one similar letter in each chart are not different statistically (Duncan 5%).
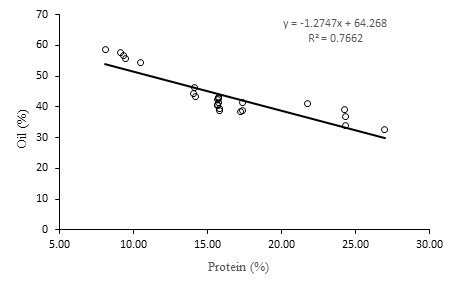
Fig. 4. Correlation between grain oil and protein contents
Table 6. Correlation between the studied components
|
|
P.H. |
C.L. |
T.G.W. |
DW |
Yield |
HI |
Capsule per plant |
Grain in capsule |
Oil (%) |
Protein (%) |
|
P.H. |
1.00 |
|
|
|
|
|
|
|
|
|
|
C.L. |
-0.37 ns |
1.00 |
|
|
|
|
|
|
|
|
|
T.G.W. |
-0.09 ns |
0.28 ns |
1.00 |
|
|
|
|
|
|
|
|
DW |
-0.57* |
0.59* |
0.74** |
1.00 |
|
|
|
|
|
|
|
Yield |
-0.35 ns |
0.51* |
0.85** |
0.87** |
1.00 |
|
|
|
|
|
|
HI |
0.01 ns |
0.34 ns |
0.86** |
0.69** |
0.91** |
1.00 |
|
|
|
|
|
Capsule per plant |
-0.35 ns |
0.49 ns |
0.83** |
0.89** |
0.97** |
0.90** |
1.00 |
|
|
|
|
Grain in capsule |
-0.43 ns |
0.77** |
0.17 ns |
0.55* |
0.55* |
0.31 ns |
0.48 ns |
1.00 |
|
|
|
Oil (%) |
-0.43 ns |
0.12 ns |
0.51 * |
0.43 ns |
0.53 * |
0.31 ns |
0.32 ns |
-0.08 ns |
1.00 |
|
|
Protein (%) |
0.08 ns |
-0.06 ns |
-0.49 ns |
-0.23 ns |
-0.39 ns |
-0.36 ns |
-0.21 ns |
0.03 ns |
-0.88** |
1.00 |
* and **: Significant at 5% and 1% probability levels, respectively; ns: non-significant.
REFERENCES