International Journal of Pharmaceutical and Phytopharmacological Research
ISSN (Print): 2250-1029
ISSN (Online): 2249-6084
|
Effect of Seed Rate and Nitrogen Management on Characteristics of Spring Quinoa (Chenopodium quinoa Willd. )
Tahereh Owji1, Farhad Mohajeri2*, Mahdi Madandoust3, Masoumeh Salehi4 |
|
1 PhD student, Department of Agriculture, Fasa Branch, Islamic Azad University, Shiraz, Iran. 2 Assistant Professor, Department of Agriculture, Fasa Branch, Islamic Azad University, Shiraz, Iran. 3 Associated Professor, Department of Agriculture, Fasa Branch, Islamic Azad University, Shiraz, Iran. 4 Assistant Professor, National Salinity Research Center, Agricultural Research, Education and Extension Organization (AREEO), Yazd, Iran. |
ABSTRACT
To investigate the effect of seed rate and nitrogen fertilizer management on quinoa traits, a two-year factorial experiment based on randomized complete block design Was done during the spiring of 2018 and 2019 in the Kharameh region. Experimental factors included seed rate at five levels of 6, 7, 8, 9, and 10 kg ha-1 seed and nitrogen fertilizer at six levels of 120, 150, and 180 kg ha-1 nitrogen divided into 2 (two-leaf, Budding) and 3 times (two-leaf, budding and pollination initiation), respectively. With increasing seed rate, grain yield increased from 624.41 to 2797.16 kg ha-1, and increasing nitrogen from 120 to 180 kg ha-1 increased the grain yield in the 2 and 3-time split treatments by 19.1% and 16.1%, respectively. Regarding the interaction between seed rate and nitrogen on grain yield, the highest yield was obtained at 10 kg ha-1 seed with 180 kg ha-1 N divided at 3 times with an average yield of 3275 kg ha-1, and the lowest grain yield was obtained from the interaction of 6 kg ha-1 seed with 120 kg ha-1 N en split at two times with average yield of 602.5 kg ha-1. With increasing seed rate, the number of sub panicles per plant significantly increased from 14.5 to 15.6. Among nitrogen levels, the highest 1000-seed weight was obtained by treatment with 180 kg using three times (1.8 g). With increasing the times of nitrogen application times at each application-level significantly increased grain yield and other measured indices.
|
Key Words: Nitrogen split, Quinoa, Crop density INTRODUCTION The need for serious changes in the cultivation pattern as well as the sustainable production of various agricultural products is completely tangible because of the climatic changes in the world, especially in Iran. On the one hand, drought and water scarcity, and the expansion of saline soils, on the other, have made the need to introduce new plants that, while growing and producing properly in unfavorable conditions have acceptable economic benefits for farmers more essential than before. Regarding this, studying and examining forgotten indigenous plants as well as the new one with potential is necessary. A proper recommended option is quinoa that has highly idealized nutritional properties and a reasonable global price for producers and is resistant to a wide range of abiotic stresses. Quinoa is a dicotyledonous plant (with the scientific name Chenopodium quinoa Willd.) from the Amaranthaceae family and Chenopodiaceae sub-family native to the Andes of the Americas [1]. Quinoa seeds are 5,000 years old and were considered sacred in Inca rural civilization as the “mother seed” [2]. Compared to many grains, quinoa seeds have a higher nutritional value. Quinoa seeds contain approximately 10-18% protein, 4.5-8.5% crude fat, 54.1-64.2% carbohydrates, 2.4-3.5% ash, and 2.1-4.9% raw fiber [3]. The plant is highly resistant to a wide range of abiotic stresses like cold, salinity, and drought and can grow in marginal soils [4]. The plant was first commercially cultivated in the state of Colorado, USA, in 1987 and is considered a suitable crop for farmers in most parts of North America [5]. Quinoa is the best plant for cultivation in soils with salinity 19 dS/m and higher [6]. Nitrogen has a role in the formation of amino acids, vitamins, and chlorophyll. If nitrogen is available in the plant in sufficient amounts, it will plant increase growth rate and storage of grain protein [7]. Erley et al. (2005) reported that quinoa strongly reacts with nitrogen fertilizer [8]. Moreover, Berti et al. (2000) reported that the highest yield of quinoa grains was obtained with the highest consumption, 225 kg of nitrogen per hectare [9]. However, excessive amounts of nitrogen reduce grain yield, as it slows down seed germination and increases plant vegetative growth [10]. An experiment [11] reported that nitrogen fertilizer increased vegetative growth, metabolism process in quinoa, and dry matter accumulation. An experiment at the University of Izmir in Turkey on the effects of nitrogen levels (zero, 50, 75, 100, 125, 150, and 175 kg of nitrogen per hectare) on quinoa seeds yield in Mediterranean water and climate conditions indicated that the best amount of nitrogen for the highest grain yield, harvest index and thousand-grain weight (TGW) was 150 kg of nitrogen per hectare [12]. Regarding this, an experiment in the UAE reported that the best level of nitrogen for quinoa is 120 kg per hectare [13]. According to the results of the experiment by Mollathani in Ahvaz, the increase in nitrogen fertilizer in some quinoa cultivars increases yield, yield components, and grain and plant nitrogen. There was a significant difference between nitrogen fertilizer levels and the cultivars in terms of the number of sub-branches, plant height, stem diameter, number and weight of inflorescence in the plant, the number of seeds per inflorescence, TGW and grain yield, dry matter yield, and harvest index [14]. Plant density is an important and influential factor in achieving optimal yield. Determining the optimal plant density has a significant role in using production resources in agricultural ecosystems [15]. The optimal number of plants per unit area is the density, as a result of which all environmental factors are fully utilized by the plant, and at the same time, competition within and outside the plant is minimized. Thus, the maximum yield possible is reached with the desired quality [16]. The number of plants per unit area depends on the ability to germinate, the percentage of germination and establishment, the competition, and the survival of seedlings. Plant density affects the production of seeds per unit area by affecting the yield of single plant seeds. In case the grain yield is low because of competition, the presence of large numbers of plants at high densities could compensate for the lack of plant yield and thus seed production per unit area [17]. In a study with four plant distances - 5, 10, 15, and 20 cm - with a fixed row spacing of 50 cm, it was observed that the number of seeds per safflower significantly increased with increase in plant distance (decrease in plant density) [18]. The results of studies [19] showed that with an increase in plant density, plant growth, and yield increased from 5 to 9 plants per square meter. Given the lack of information on the interaction between planting density and nitrogen fertilizer use in quinoa in Iran, the experiment was conducted to determine the best density of cultivation and optimal consumption of nitrogen fertilizer.
MATERIALS AND METHODS To examine the interaction of seed rate and nitrogen fertilizer management on crop characteristics, yielding components of spring experimental quinoa was conducted in two consecutive years in saline conditions of Fars (Kharameh), with a latitude of 29 degrees and 32 minutes and a longitude of 53 degrees and 11 minutes with an altitude of 1597 meters above sea level. This experiment was performed on March 17, 2018, and 2019 as a factorial in the form of a complete randomized block design with 3 replications. Experimental factors were seed rate at 5 levels (6, 7, 8, 9, and 10 kg/ha) and distribution factor of various values of urea fertilizer at 6 levels (120, 150, and 180 kg of nitrogen per hectare in 2 and 3 divisions: a) in two-leaf and floral initiation and b) two-leaf, floral initiation, and pollination initiation). The salinity of the farm was 12 ds/m. The genotype used was TITICACA and was obtained from Yazd Salinity Research Center. The traits examined were agronomic characteristics like plant height, leaf area, leaf dry weight, and plant dry weight and grain yield components like panicle length, panicle diameter, the number of sub-panicles, TGW, and grain yield. Sampling was performed to calculate grain yield in one square meter per plot and to calculate yield components from an average of 15 plants per plot. TGW was obtained by calculating the weight of 100 grains with a moisture content of 14% using a digital scale. To examine the growth and to degrade it, 4 destructive samplings were done four weeks after greening once a week, and height, plant and leaf dry weights, and leaf area were obtained. After collecting and completing data collection in the experiments stated, SAS software was used to analyze the variance and the mean comparisons were performed with Duncan's Multiple Range Test (DMRT) at 1 and 5% level.
RESULTS AND DISCUSSION
Table 1. Results of physical and chemical analysis of farm soil before testing
The results of physical and chemical analysis of the studied field soil in the experimental years are shown in Table 1. According to the results, the studied field soil had high salinity, slight alkaline acidity, low organic carbon, moderate to good phosphorus and potassium, and low consumption elements of iron, zinc, manganese, and copper suitable and loam soil texture. There was no need to wash the soil to reduce salinity given the high tolerance of quinoa to soil salinity. Moreover, according to the results, potassium and phosphorus fertilizers and foliar application of low-consumption elements were not used because of the appropriate level of these elements.
Table 2: Summary of meteorological statistics of the experimental period
Table 2 is a summary of the meteorological statistics of the experimental period in 2017-2018 and 2018-2019. According to these results, the mean maximum temperature in the studied months in the first and second years of the experiment belongs to November with an average of 38.5 and 39.9 °C, respectively, and the average minimum temperature in both years of the experiment belongs to March, they were 3.4 and 3.8 °C, respectively. Total precipitation during the experimental period in 2017-2018 and 2018-2019 was 43.2 and 123.8 mm, respectively. According to the results of the analysis of biennial compound variance in Table 3, the effect of year on plant height, plant dry weight, length and diameter of panicle at 1% level and on the number of sub-panicle and grain yield at 5% level was significant and not on the rest. The results of variance analysis showed that the independent effect of seed and nitrogen content as well as the interaction of these two factors on all the studied traits was significant at a 1% level. The interaction of the year and seed rate on the dry weight of the plant, panicle length and grain yield at the level of 1% and panicle diameter and the number of sub-panicles at 5% level was significant and not significant on other traits. The interaction of year and nitrogen on the diameter of the panicle at the level of 1% and the length of the panicle and grain yield at the level of 5% was significant and not significant on the other traits.
Table 3: Summary of two-year compound variance analysis for Plant height (P.H.), Leaf Area (L.A), Leaf Dry Weight (L.D.W.), Plant Dry Weight (P.D.W.) [after 4th. Week], Panicle Length (Pan.L.), Panicles Diameter (Pan.D). Sub Panicles no. (S. Pan. no.). 1000-Grain Weight (T.G.W) and Grain Yield (G.Y.) of Quinoa in different levels of seed rate and nitrogen
** and *: Significant at the 1% and 5% probability levels, respectively ns: non-significant
Table 4: The comparison of the mean simple effects of seed rate and different levels of nitrogen in two years on yield, yield components, and some agronomic traits of quinoa
The means with at least one common letter in each column do not have a statistically significant difference (Duncan 5%). *N1 and N2: 120 Kg ha-1 in two times (two-leaf and floral initiation) and three times (two-leaf, floral initiation and beginning of pollination stages), N3, N4: 150 Kg ha-1 in two times (two- leaf and floral initiation) and three times (two-leaf, floral initiation and beginning of pollination stages), N5 and N6: 180 Kg ha-1 in two times (two- leaf and floral initiation) and three times (two- leaf, floral initiation and beginning of pollination stages), ** S.r 1, S.r 2, S.r 3, S.r 4 and S.r 5 are 6, 7, 8, 9 and 10 Kg ha-1, respectively
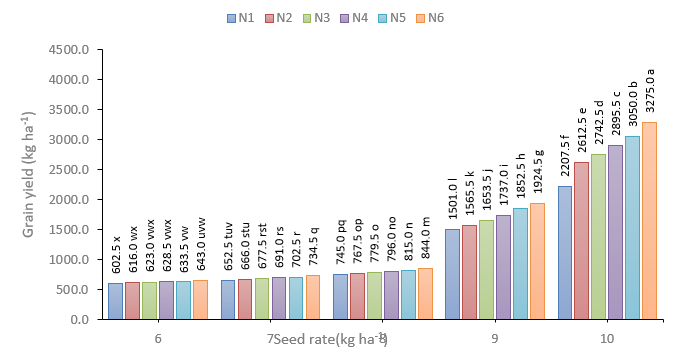
The results of comparing the mean effects of seed rate on the traits examined in Table 4 showed that by increasing the seed rate from 6 to 10 kg/ha, TGW increased significantly from 1.25 to 2.26 g. Some scholars have reported an increase in TGW with an increase in plant density in corn. With an increase in nitrogen used from 120 to 180 kg/ha, TGW increased significantly. Increase in the number of times nitrogen consumption per level significantly increased TGW by 1.8, 2.9, and 4%, respectively, for 120, 150, and 180 kg of nitrogen per hectare. The highest and lowest TGW belonged to treatments 180 kg of nitrogen three times (1.8 g) and 120 kg of nitrogen two times (1.51 g), respectively, in the highest and lowest groups with significant differences. Increased nitrogen consumption may have reduced competition between grains for food, so there were more photosynthetic materials per plant and TGW increased. The results of the researchers also confirmed that because of the lack of nitrogen in various treatments for nitrogen consumption, the average weight of corn grain decreased by 9-25% [20]. With an increase in the seed rate consumed from 6 to 10 kg/ha, plant and leaf dry weight increased significantly, the highest plant dry weight belonged to 10 kg/ha (111.50 g / m2) seed weight that was significantly higher compared to the lowest seed rate with an average seed size (91 g / m2). The leaf dry-weight increased significantly from 1.07 to 2.14 g / m2 due to the increase in seed rate (Table 4). The increase in nitrogen increases plant and leaf dry weight per unit area. The increase in nitrogen from 120 kg to 180 kg/ha in the two- and three-stage division method increased dry leaf weight by 8.5% and 8.9%, respectively, and 29.9% and 27% dry plant weight, respectively. Dry plant weight because of the consumption of any amount of nitrogen in the three-stage division method compared to the two-stage division method increased by 9.4, 5.7, and 7%, respectively, in 120, 150, and 180 kg nitrogen per ha. Nitrogen is one of the key environmental factors in controlling biomass and yield through its effect on leaf area index (receiving radiation) and photosynthetic capacity per unit area of the leaf [21]. According to researchers, the growth rate of a plant can be controlled by the presence of nutrients in the plant [22]. The nitrogen assigned to the leaf increases the efficiency of nitrogen use. Thus, the absorption of carbon dioxide and the production of dry matter per unit of nitrogen increase [23]. Researchers reported that dry matter yield can increase by increasing nitrogen fertilizer [24]. In examining the interaction of nitrogen and seed rate on dry plant and leaf weights, the highest interaction was obtained using 180 kg/ha nitrogen divided into three doses and the seed 10 kg/ha (2.35 g / m2 dry leaf weight and 143.16 g / m2 dry plant weight). In each of the traits stated, the traits increased with an increase in seed and level and frequency of nitrogen fertilizer use (Table 5). The length and diameter of the panicle and the number of sub-panicles, to some extent, increased significantly with an increase in seed rate. As the seed size increased from 6 to 10 kg, the length of the panicle increased from 21.99 to 24 cm (13.3%). The increase in seed size from 6 to 10 kg increased the diameter of the panicle by 23.3%. With an increase in seed size, the maximum number of sub-panicles of seed weight was 9 kg/ha and 17.21 plants per plant. Moreover, the results indicated a significant increase in the length and diameter of the panicle and the number of sub-panicles with an increase in nitrogen. The findings showed that with an increase in the number of fertilizer use times, these traits increased at each nitrogen level (Table 4). In the 180-kg interaction, nitrogen was placed in the highest statistical group three times with 10 kg/ha seed length and panicle diameter, and this system was not established in higher seed rates in the case of the number of sub-panicle (Table 5). Plant height increased with an increase in nitrogen and seed contents. The increase in the seed rate from 6 to 10 kg/ha increased the plant height by 2.5%. The maximum plant height among the studied treatments belonged to 10 kg/ha seed with an average of 112.01 cm, which was in the highest statistical group with a significant difference compared to other treatments. The increase in nitrogen as well as the number of times it was used increased the plant height. The increase in the number of times nitrogen used from two to three stages increased the plant height by 3, 4.7, and 4% at levels of 120, 150, and 180 kg of nitrogen, respectively (Table 4). It seems that increasing nitrogen consumption by increasing the durability and specificity of leaf area has provided better conditions for using sunlight and producing photosynthetic materials, ultimately leading to a significant increase in plant height [25]. The lack of nitrogen in cereals reduces plant height [26]. Another group of researchers [27] argued that the increase in nitrogen fertilizer, quinoa height increased as well. Other scholars have mentioned the plant height response to different levels of nitrogen consumption [28, 29]. With an increase in nitrogen levels in each of the densities examined, plant height increased too and the increase in the number of times nitrogen used in each of the predicted densities increased the plant height. The results showed the highest plant height from the interaction of three-stage 180 kg nitrogen with a density of 6 kg of seeds per hectare 122.50 cm), which increased by 21.9% compared to the lowest plant height due to the interaction of 9 kg of seed density per ha and 120 kg of divided nitrogen in two stages (Table 5). The increase in the seeds used from 6 to 10 kg/ha increased the grain yield from 246.4 kg/ha to 2797.16 kg/ha. Decreased grain yield can be justified and compensated by increasing the number of plants with increasing planting distance (seed reduction). The superiority of production in the superior treatment can be attributed to a sufficient number of plants and at the same time to the proper harvesting of the plant from the available resources [27]. Delayed use of nitrogen fertilizer in three-time use case increased grain yield. Increasing the nitrogen significantly increased the yield of quinoa seeds. The lowest grain yield was in the treatment of nitrogen use at 120 kg/ha in two rounds at two-leaf and floral initiation by 1141.7 kg/ha and the highest was at 180 kg nitrogen per hectare in 3 stages of two-leaf, floral initiation, and pollination initiation with an average of 1484.2 kg/ha. The increase in the number of times nitrogen fertilizer used at 120, 150, and 180 kg/ha levels increased the yield by 9.09%, 4.2%, and 5.2%, respectively. With an increase in nitrogen from 120 to 150 kg/ha, grain yield in two and three-round treatments increased by 13.4 and 8.3%, respectively, and with an increase in nitrogen from 150 to 180 kg, 9.8 and 9.9, respectively (Table 4). These results are in line with those of Wopereis-Pura (2002) [30]. They concluded that the late consumption of nitrogen in rice crop increases yields in wet and dry seasons by 0.4 and 1 t/ha, respectively. Many studies have been conducted on the timing and amount of nitrogen fertilizer use to determine fertilizer recommendations for different rice cultivars [31]. From 1970 to 1980, most of the nitrogen management studies focused on increasing nitrogen efficiency by reducing its waste, so the farmers were advised to use fertilizer in 2 or 3 stages during the growing season [32]. Thus, for the desired grain yield, the amount and timing of nitrogen fertilizer use are important [31]. In the present study and in examining the interaction of levels and number of rounds of using nitrogen fertilizer with seed rate on grain yield, it was seen that the trend of changes in any amount of nitrogen was increasing with increasing seed rate (Figure 1). Grain yield increased with an increase in the number of divisions per nitrogen. The highest grain yield was obtained from the interaction of 180 kg of nitrogen treatment in three rounds with 10 kg of seeds per hectare (3275 kg/ha), which was in the highest statistical group and the lowest grain yield was obtained from the interaction of 120 kg of nitrogen twice with 6 kg of seed (602.5 kg/ha) (Figure 1).
Table 5: The average comparison of interaction between seed rate and different levels of nitrogen in two years on some traits of Quinoa
Averages with at least one common letter in each column do not have statistically significant differences (Duncan 5%). *N1 and N2: 120 Kg ha-1 in two times (two- leaf and floral initiation) and three times (two- leaf, floral initiation and beginning of pollination stages), N3, N4: 150 Kg ha-1 in two times (two- leaf and floral initiation) and three times (two-leaf, floral initiation and beginning of pollination stages), N5 and N6: 180 Kg ha-1 in two times (two- leaf and floral initiation) and three times (two- leaf, budding and beginning of pollination stages), ** S.r 1, S.r 2, S.r 3, S.r 4 and S.r 5 are 6, 7, 8, 9 and 10 Kg ha-1, respectively
Figure 1: The average comparison of interaction between seed rate and different level of nitrogen in two years on grain yield of Quinoa
Averages with at least one letter in common have no statistically significant differences (Duncan 5%)
CONCLUSION The results of two years of experiments in the study indicated that the appropriate seed rate to reach the desired plant density to obtain maximum grain yield in Kharameh and the spring cultivation of quinoa was 10 kg/ha. At the highest rate of using seed compared to the lowest (6 kg/ha), grain yield increased about 4.4 times. There was a significant difference between grain yield at 150, 120, and 180 kg nitrogen per ha in both two and three-stage division methods. The three-round use in each of the values considered yielded more performance compared to two-round use, but increasing the use rounds from two to three times could not increase performance similar to an increase in nitrogen levels. The best treatment for nitrogen application in the present study was using 180 kg of pure nitrogen fertilizer in three rounds (two-leaf, floral initiation, and beginning of pollination stages). According to the results obtained and the changes in yield against seed rate and the increase in nitrogen level, it seems that the cultivar cultivated in this experiment could accept higher values of seeds and also more fertilization, were conducting experiments with higher seed values per unit area and higher nitrogen levels is recommended to obtain more yields.
REFERENCES
|
||||||||||||||||||||||||||||||||||||||||||||||||||||||||||||||||||||||||||||||||||||||||||||||||||||||||||||||||||||||||||||||||||||||||||||||||||||||||||||||||||||||||||||||||||||||||||||||||||||||||||||||||||||||||||||||||||||||||||||||||||||||||||||||||||||||||||||||||||||||||||||||||||||||||||||||||||||||||||||||||||||||||||||||||||||||||||||||||||||||||||||||||||||||||||||||||||||||||||||||||||||||||||||||||||||||||||||||||||||||||||||||||||||||||||||||||||||||||||||||||||||||||||||||||||||||||||||||||||||||||||||||||||||||||||||||||||||||||||||||||||||||||||||||||||||||||||||||||||||||||||||||||||||||||||||||||||||||||||||||||||||||||||||||||||||||||||||||||||||||||||