International Journal of Pharmaceutical and Phytopharmacological Research
ISSN (Print): 2250-1029
ISSN (Online): 2249-6084
|
Development and Validation of Stability Indicating Rp-Hplc Method for the Estimation of Bisoprolol Fumarate in Bulk and Pharmaceutical Dosage Form
Khagga Bhavyasri*, J. Soujanya Goud, R. Sewthasri, Mogili Sumakanth |
|
Department of Pharmaceutical Analysis, RBVRR Women’s College of Pharmacy, India. |
ABSTRACT
A rapid and precise reverse phase High-Performance Liquid Chromatographic method has been developed for the validation of Bisoprolol fumarate, in its pure form as well as in tablet dosage form. Chromatography was carried out on a sunsil C18 (150mm X 4.6mm, 5µ)column using a mixture of Acetonitrile: Water (60:40)v/v as the mobile phase at a flow rate of 0.8ml/min, the spectrometric detection was carried out at 223nm. The retention time of the bisoprolol fumarate was 1.990min respectively. The method produces linear responses in the concentration range of 4-14µg/ml of bisoprolol fumarate. The method precision for the drug bisoprolol fumarate was found to be within the limits. The method is useful in the quality control of bulk and pharmaceutical formulations.
Key Words: Bisoprolol fumarate, RP-HPLC, validation, ICH Guidelines.
Bisoprolol fumarate is the most potent beta1selective beta-blocker. it has the highest power of selective beta1activity and by blocking the beta1adrenergic receptors it reduces the heart rate, and contraction of the heart thus lowers the blood pressure. FDA approved on July 7, 1992 [1].
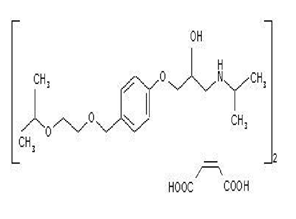
The chemical name of Bisoprolol fumarate is 1-[(propan-2-yl) amino]-3-(4-{[2-(propan-2-yloxy)ethoxy]methyl}phenoxy)propan-2-ol. The molecular formula of Bisoprololfumarate C18H31NO4.
The main objective of this proposed method is to develop a new rapid, simple, precise, accurate and economical analytical method on the basis of RP-HPLC, which in turn is an efficient method for stimation of a component in a mixture [2, 3], for the estimation of Bisoprolol fumarate [4].
 snip
snip
Figure 1: structure of Bisoprololfumarate
MATERIALS AND METHODS:
Pharmaceutical grade Bisoprololfumarate was provided by R.B.V.R.R women's college of pharmacy. The solvents used for the procedure are of analytical grade. The HPLC grade chemical used is Acetonitrile and double distilled water and they were obtained from SDFCL. All the solutions were filtered through a vacuum filter and sonicated. The marketed formulation of Bisoprololfumarate(Concor) is obtained from Merck Pharma Limited [5].
Apparatus:
U.V. Visible double beam spectrophotometer Shimadzu along with two matched cuvettes was used. Stock solutions of the samples were prepared in AR grade Acetonitrile and used for analysis. The HPLC system used is the water HPLC model 2695. The column used was sunsil C18 (150mm X 4.6mm, 5µ). Auto sampler 171 Plus and the detector consisting of waters dual λ absorbance detector operated at 254nm. Software used for HPLC is empower 3.0.
Chromatographic conditions:
As the drug is soluble in Acetonitrile, the experimentation was started with the mobile phase Acetonitrile and water 70:30 and tried at different levels of a combination containing these solvents. The optimal composition of the mobile phase was determined as Acetonitrile and water at 60:40. The mobile phase was filtered through a 0.45µm nylon filter and then sonicated for at least 10min [6].
VALIDATION PARAMETERS
SPECIFICITY: Specificity is the ability to asses unequivocally the analyte in the presence of components which may be expected to be present preparation of standard 10 µg/ml solution [7]. From the standard stock solution- 2, 1 ml was pipette out and transferred into another 10ml volumetric flask and the volume was made up to the mark with diluent (Acetonitrile: Water (60:40%v/v) SYSTEM SUITABILITY
Preparation of Standard Solution:
From the standard stock solution- 2, 1 ml was pipette out and transferred into another 10ml volumetric flask and the volume was made up to the mark with diluent (Acetonitrile: Water (60:40%v/v). Procedure: The standard solutions were injected for five times and measured the area for all five injections in HPLC. The %RSD for the area of five replicate injections was found to be within the specified limits. PRECISION: The precision of an analytical procedure expresses the closeness of agreement (degree of scattering) between a series of measurements obtained from the multiple sampling of the same homogeneous sample under the prescribed conditions. Intraday precision
It is defined as the precision under the same operating conditions over a small interval of time
Preparation of standard 10μg/ml solution
From the standard stock solution- 2, 1 ml was pipette out and transferred into another 10ml volumetric flask and the volume was made up to the mark with diluent (Acetonitrile: Water (60:40%v/v) Inter day precisionIntra day precision is done within the laboratories variation i.e., different days, different instruments and different analysts.➢ Preparation of standard 10μg/ml solution. From the standard stock solution- 2, 1 ml was pipette out and transferred into another 10ml volumetric flask and the volume was made up to the mark with diluent (Acetonitrile: Water (60:40%v/v)
Procedure:
10μg/ml solution was injected into the HPLC system for five replicates, and results were found within the limits.
LINEARITY:
The linearity of an analytical procedure is its ability (within a given range) to obtain test results which are directly proportional to the concentration (amount) of analyte in the sample. The results were shown within the limits.
Procedure;
Preparation of standard stock solution 1: Weigh equivalent to 10 mg of bisoprolol fumarate was weighed and transferred into 10ml volumetric flask and then dissolved in double distilled water and made up to mark (1000μg/ml)
Preparation of standard stock solution 2: From the stock, solution-1,1ml was pipette and transferred into a 10ml volumetric flask and then made up to mark (100μg/ml) [8].
➢ Preparation of 4μg/ml standard stock solution 2: From the standard stock solution 2, 0.4 ml was pipette and transferred into another 10ml volumetric flask and made up to the mark with diluent.
➢ Preparation of 6μg/ml standard stock solution 2: From the standard stock solution 2, 0.6 ml was pipette and transferred into another 10ml volumetric flask and made up to the mark with diluent.
➢ Preparation of 8μg/ml standard stock solution 2: From the standard stock solution 2, 0.8 ml was pipette and transferred into another 10ml volumetric flask and made up to the mark with diluent.
➢ Preparation of 10μg/ml standard stock solution 2: From the standard stock solution 2, 1 ml was pipette and transferred into another 10ml volumetric flask and made up to the mark with diluent.
➢ Preparation of 12μg/ml standard stock solution 2: From the standard stock solution 2, 1.2 ml was pipette and transferred into another 10ml volumetric flask and made up to the mark with diluent.
➢ Preparation of 14μg/ml standard stock solution 2: From the standard stock solution 2, 1.4 ml was pipette and transferred into another 10ml volumetric flask and made up to the mark with diluent.
Calibration curve (linearity):
The standard solutions were prepared by dilution of stock solution with Acetonitrile in concentration range 4µg/ml, 6µg/ml, 8µg/ml, 10µg/ml, 12µg/ml and 14µg/ml with a concentration on X-axis and absorbance on Y-axis at 223nm. The correlation coefficient for Valganciclovir was found to be 0.999 [9].
Precision:
The precision of the analytical method was determined by taking 1ml of bisoprolol fumarate from stock solution 2 was pipetted out and taken into a 10ml volumetric flask and made up with diluent. (10 µg/ml of bisoprolol fumarate) This solution of bisoprolol fumarate was analyzed in HPLC for six replicates at the selected wavelength 223nm [10].
Accuracy:
The accuracy of the method was determined by recovery experiments.
Preparation of sample stock solution 1:
10 tablets were weighed and powdered. from it the amount of drug to be weighed is calculated i.e., 343.2mg and transferred into a 10ml volumetric flask then made up to the mark with water. Then the solution was sonicated (1000μg/ml)
Preparation of sample stock solution 2:
From previously prepared sample stock solution 1, 1ml of the solution was pipette out and transferred into another 10ml volumetric flask and made up to the mark with water (100μg/ml).
➢ Preparation of 4 µg/ml sample stock:
From the stock solution 2, 0.4ml was pipette and transferred into a 10ml volumetric flask and then made up to mark (4μg/ml)Preparation of standard stock solution 1 :
10mg of bisoprolol fumarate was weighed and transferred into 10ml of volumetric flask and then dissolved in diluent and made up to the mark with diluent. (1000μg/ml) Preparation of standard stock solution 2: From the stock solution 1ml was pipette and transferred it into another 10ml volumetric flask and made up to the mark with diluent (100μg/ml)
➢ Preparation of 2 µg/ml standard solution: From the working standard solution 2, 0.2 ml was pipette and transferred into another 10ml volumetric flask and made up to the mark with diluent.
➢ Preparation of 4 µg/ml standard solution: From the working standard solution 2, 0.4 ml was pipette and transferred into another 10ml volumetric flask and made up to the mark with diluent.
➢ Preparation of 6 µg/ml standard solution: From the working standard solution 2, 0.6 ml was pipette and transferred into another 10ml volumetric flask and made up to the mark with diluents.
➢ Preparation of 4 µg/ml sample solution: 0.4 ml of sample solution -2, was pipette out and transferred into a 10ml volumetric flask and made up to the mark with diluent.
➢ Preparation of 50% solution: 1ml of 2μg/ml standard solution was spiked to 1ml of 4μg/ml sample solution of bisoprolol fumarate
➢ Preparation of 100% solution: 1ml of 4μg/ml standard solution was spiked to 1ml of 4μg/ml sample solution of bisoprolol fumarate.
➢ Preparation of 150% solution: 1ml of 6μg/ml standard solution was spiked to 1ml of 4μg/ml sample solution of bisoprolol fumarate.
Procedure:
The above-prepared accuracy 50%,100%,150% level solutions were injected into the HPLC system for three replicates. The recovery studies were carried out three times and the percentage recovery and percentage standard deviation of the recovery for Bisoprololfumarate was calculated. The results were shown within the limits [11].
Robustness:
It is a measure of its capacity to remain unaffected by small, but deliberate variations in method parameters and provides an indication of its reliability during normal usage. Standard 10g/ml solution was prepared by taking 1ml from solution B and transferred into a 10ml volumetric flask and the volume was made up to the mark with methanol(10µg/ml) and this solution was scanned at two different flow rates i.e., 0.7ml and 0.9ml [12].
Limit of detection (LOD) and Limit of quantification (LOQ):
The LOD and LOQ were separately determined and calculated based on the calibration curve of a standard solution [13].
Assay of Bisoprolol Fumarate: Preparation of Sample stock Solution 1: Accurately weigh and powder 10 tablets. From it, the amount of drug to be weighed is calculated i.e., 343.2 mg and transferred into a 10ml of clean dry volumetric flasks, and dilute up to the mark with diluent. then the solution is sonicated which is 1000µg/ml solution.
Preparation of Sample stock Solution 2: From previously prepared sample stock solution 1ml of the solution was pipetted out and transferred into a 10ml of clean dry volumetric flasks, and dilute up to the mark with diluent, which is 100µg/ml solution. Preparation of 10µg/ml Sample Solution:1ml of the solution was pipette out from sample stock solution -2 and transferred into a 10ml of clean dry volumetric flasks, and dilute up to the mark with diluent.
Procedure:
Inject the three replicate injections of standard and sample solutions and calculate the assay by using the formula:

RESULTS AND DISCUSSION
The present study was performed to develop a rapid precise and accurate method of Bisoprolol fumarate using RP-HPLC in bulk drugs. The optimized chromatographic conditions were maintained using sunsil C18 column (250 X 4.6mm, 5µm) and mobile phase Acetonitrile: water in the ratio of 60:40 with a flow rate of 1ml/min at UV detection 223nm. The retention time of Bisoprolol fumarate was found to be 1.990 min [2].
Wavelength Spectrum:
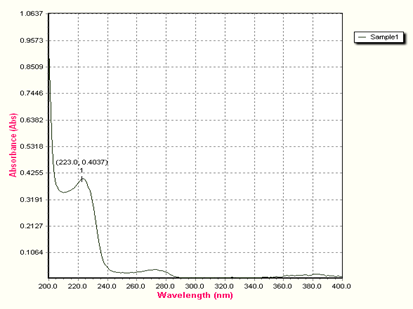
Figure 2: U.V – Visible Spectrum of Bisoprolol Fumarate
Blank:
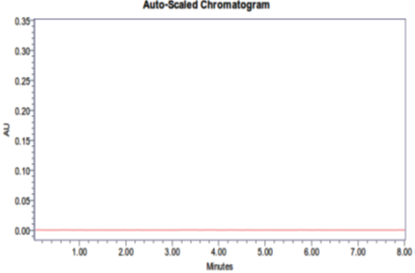
Figure 3: Chromatogram of blank solution (mobile phase)
SPECIFICITY

Figure 4: Chromatogram of Bisoprolol Fumerate sample 10μg/ml solution
SYSTEM SUITABILITY

Figure 5: Chromatogram of System suitability (10μg/ml) injection -1

Figure 6: Chromatogram of System suitability (10μg/ml) injection -2

Figure 7: Chromatogram of System suitability (10μg/ml) injection -3

Figure 8: Chromatogram of System suitability (10μg/ml) injection -4

Figure 9: Chromatogram of System suitability (10μg/ml) injection -5
Table 1: System suitability results
|
S no |
Name |
Rt |
Area |
Height |
USP plate count |
USP Tailing |
|
1 |
Bisoprolol fumarate |
1.990 |
927364 |
193589 |
3591 |
1.2 |
|
2 |
Bisoprolol fumarate |
1.990 |
923567 |
192481 |
3567 |
1.2 |
|
3 |
Bisoprolol fumarate |
1.990 |
933437 |
189593 |
3480 |
1.2 |
|
4 |
Bisoprolol fumarate |
1.990 |
933672 |
193597 |
3576 |
1.2 |
|
5 |
Bisoprolol fumarate |
1.990 |
923651 |
193415 |
3589 |
1.2 |
|
|
Mean |
|
928338.2 |
|
|
|
|
|
Std. Dev |
|
5003.26 |
|
|
|
|
|
% RSD |
|
0.27 |
|
|
|
PRECISION
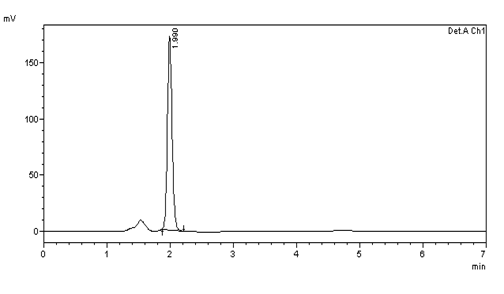
Figure 10: Intra day precision (10μg/ml) injection -1

Figure 11: Intra day precision (10μg/ml) injection -2

Figure 12: Intra day precision (10μg/ml) injection -3

Figure 13: Intra day precision (10μg/ml) injection -4

Figure 14: Intra day precision (10μg/ml) injection -5
Table 2: Results of Intraday precision
|
S no |
Name |
Rt |
Area |
Height |
USP plate count |
USP Tailing |
|
1 |
Bisoprolol fumarate |
1.990 |
914794 |
2686.077 |
3567 |
1.2 |
|
2 |
Bisoprolol fumarate |
1.990 |
933664 |
2897.886 |
3480 |
1.2 |
|
3 |
Bisoprolol fumarate |
1.990 |
978357 |
3028.416 |
3589 |
1.2 |
|
4 |
Bisoprolol fumarate |
1.990 |
965849 |
2957.008 |
3572 |
1.2 |
|
5 |
Bisoprolol fumarate |
1.990 |
970721 |
2600.575 |
3496 |
1.2 |
|
|
Mean |
|
952677 |
|
|
|
|
|
Std. Dev |
|
27180.72 |
|
|
|
|
|
% RSD |
|
0.2 |
|
|
|
Discussion: Results were found to be within the limits, acceptance criteria % RSD less than 2.

Figure 15: Inter day precision (10μg/ml) injection -1

Figure 16: Inter day precision (10μg/ml) injection -2

Figure 17: Inter day precision (10μg/ml) injection -3

Figure 18: Intra day precision (10μg/ml) injection -4

Figure 19: Inter day precision (10μg/ml) injection -5
Table 3: Results of Inter day precision
|
S no |
Name |
Rt |
Area |
Height |
USP plate count |
USP Tailing |
|
1 |
Bisoprolol fumarate |
1.990 |
970920 |
193589 |
3589 |
1.2 |
|
2 |
Bisoprolol fumarate |
1.990 |
965859 |
191478 |
3562 |
1.2 |
|
3 |
Bisoprolol fumarate |
1.987 |
978352 |
198925 |
3496 |
1.2 |
|
4 |
Bisoprolol fumarate |
1.990 |
933654 |
194397 |
3598 |
1.2 |
|
5 |
Bisoprolol fumarate |
1.987 |
914793 |
196543 |
3579 |
1.2 |
|
|
Mean |
|
928275 |
|
|
|
|
|
Std. Dev |
|
8833.677 |
|
|
|
|
|
% RSD |
|
0.2 |
|
|
|
Discussion: Results were found to be within the limits, acceptance criteria % RSD less than 2.
LINEARITY:
From the standard working solution (100μg/ml), appropriate dilutions were made to get a series of concentration i.e., 4,6,8,10,12,14 μg/ml and injection into the system at 232nm.
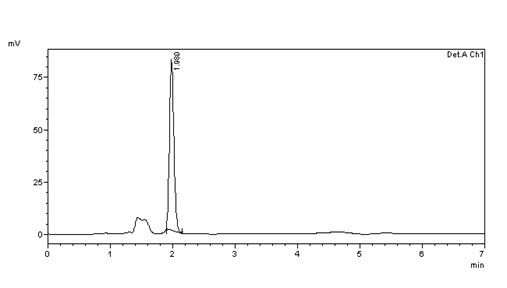
Figure 20: Linearity Chromatogram of 4µg/ml of Bisoprolol fumarate solution
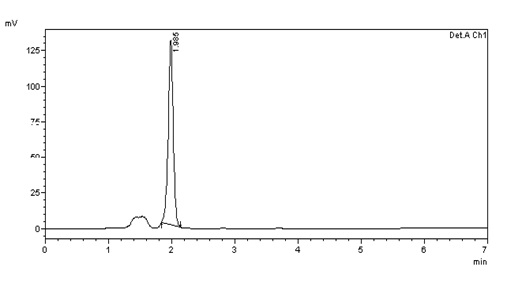
Figure 21: Linearity Chromatogram of 6µg/ml of Bisoprolol fumarate solution
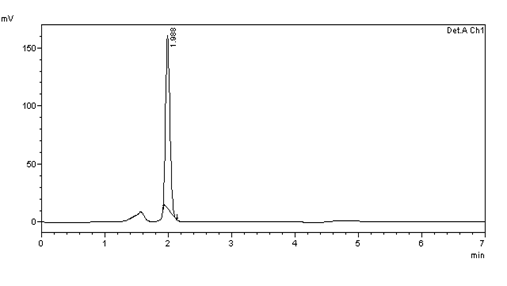
Figure 22: Linearity Chromatogram of 8µg/ml of Bisoprolol fumarate solution

Figure 23: Linearity Chromatogram of 10µg/ml of Bisoprolol fumarate solution
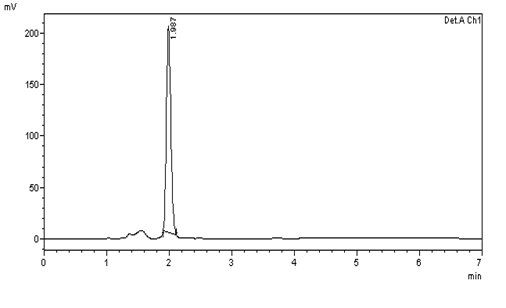
Figure 24: Linearity Chromatogram of 12µg/ml of Bisoprolol fumarate solution
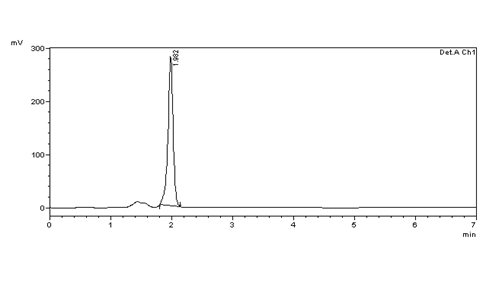
Figure 25: Linearity Chromatogram of 14µg/ml of Bisoprolol fumarate solution
Table 4: results of Linearity
|
S.no |
Concentration mg/ml |
Average Peak Area |
|
|
1 |
4 |
397701 |
|
|
2 |
6 |
584753 |
|
|
3 |
8 |
739490 |
|
|
4 |
10 |
910721 |
|
|
5 |
12 |
1069565 |
|
|
6 |
14 |
1225815 |
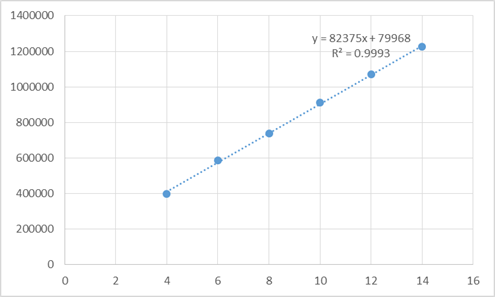
Figure 26: Linearity plot of bisoprolol fumarate
LINEARITY PLOT:
The plot of concentration (x) versus the Average Peak Area (y) data of Bisoprolol fumarate
is a straight line.
Y = mx + c
Slope (m) = 82375
Intercept (c) = 79968
Correlation Coefficient (r) = 0.9993
Discussion: Results were found to be within the limits, acceptance criteria correlation coefficient 0.999
ACCURACY:
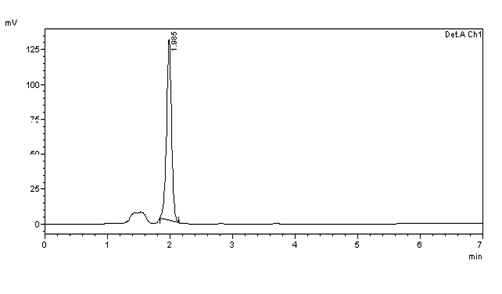
Figure 27: Chromatogram of Accuracy 50% solution –injection 1

Figure 28: Chromatogram of Accuracy 50% solution –injection 2

Figure 29: Chromatogram of Accuracy 50% solution –injection 3
Table 5: Results of 50% Accuracy
|
Sno |
Name |
Rt |
Area |
Height |
USP Tailing |
USP plate count |
Injection |
|
1 |
Bisoprolol fumarate |
1.985 |
691753 |
31339 |
1.3 |
3962 |
1 |
|
2 |
Bisoprolol fumarate |
1.985 |
682189 |
31928 |
1.3 |
3991 |
2 |
|
3 |
Bisoprolol fumarate |
1.985 |
693938 |
32109 |
1.3 |
3896 |
3 |
|
4 |
Mean |
|
689113.3 |
|
|
|
|
|
5 |
Std.deviation |
|
6052.793 |
|
|
|
|
|
6 |
%R.S.D |
|
0.8 |
|
|
|
|
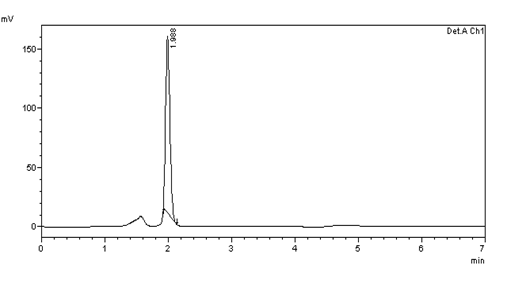
Figure 30: Chromatogram of Accuracy 100% solution –injection 1
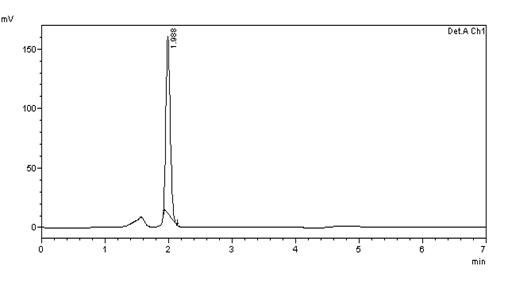
Figure 31: Chromatogram of Accuracy 100% solution –injection 2
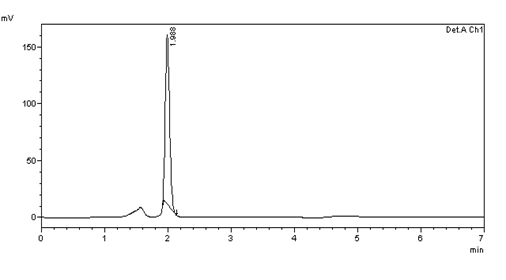
Figure 32: Chromatogram of Accuracy 100% solution –injection 3
Table 6: results of 100% Accuracy
|
S.no |
Name |
Rt |
Area |
Height |
USP Tailing |
USP plate count |
Injection |
|
1 |
Bisoprolol fumarate |
1.988 |
678712 |
33765 |
1.2 |
3589 |
1 |
|
2 |
Bisoprolol fumarate |
1.988 |
678380 |
32754 |
1.3 |
3562 |
2 |
|
3 |
Bisoprolol fumarate |
1.988 |
672452 |
33642 |
1.2 |
3496 |
3 |
|
4 |
Mean |
675416 |
|||||
|
5 |
Std. deviation |
4191.7 |
|||||
|
6 |
% RSD |
0.6 |
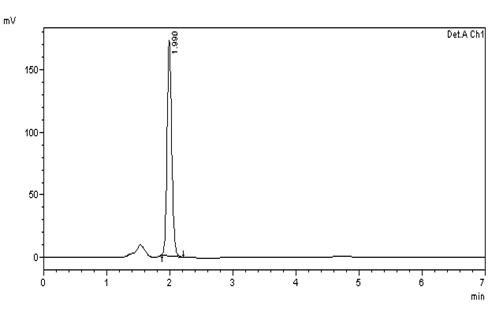
Figure 33: Chromatogram of Accuracy 150% solution –injection 1

Figure 34: Chromatogram of Accuracy 150% solution –injection 2

Figure 35: Chromatogram of Accuracy 150% solution –injection 3
Table 7: Accuracy Results
|
S no |
Name |
Rt |
Area |
Height |
USP Tailing |
USP plate count |
Injection |
|
1 |
Bisoprolol fumarate |
1.988 |
678712 |
33765 |
1.2 |
3589 |
1 |
|
2 |
Bisoprolol fumarate |
1.988 |
678380 |
32754 |
1.3 |
3562 |
2 |
|
3 |
Bisoprolol fumarate |
1.988 |
672452 |
33642 |
1.2 |
3496 |
3 |
|
4 |
Mean |
675416 |
|||||
|
5 |
Std. deviation |
4191.7 |
|||||
|
6 |
% RSD |
0.6 |
|
S.no |
Name |
Standard+Sample |
Peak Area |
% Recovery |
% RSD |
Mean Recovery |
|
|
1 |
Bisoprolol fumarate |
4+2 |
691753 |
99.9 |
0.2 |
|
|
|
4+2 |
682189 |
99.7 |
|||||
|
4+2 |
693938 |
99.2 |
|||||
|
2 |
Bisoprolol fumarate |
4+4 |
678712 |
98.3 |
0.6 |
99.30% |
|
|
4+4 |
678380 |
99.6 |
|||||
|
4+4 |
672452 |
98.4 |
|||||
|
3 |
Bisoprolol fumarate |
4+6 |
914794 |
99.7 |
0.6 |
||
|
4+6 |
933664 |
99.5 |
|||||
|
4+6 |
978357 |
99.9 |
Discussion: Results were found within the limits, acceptance criteria 98-102%
|
% Concentration (at specification level) |
Area |
Amount Added (ppm) |
Amount Found (ppm) |
% Recovery |
Mean Recovery |
|
50% |
290160 |
20 |
20.2 |
98% |
99% |
|
100% |
580320 |
40 |
40 |
100% |
|
|
150% |
725400 |
50 |
50.1 |
99% |
|
Acceptance Criteria:
The percentage recovery was found to be within the limits (98 % to 1058%).
ROBUSTNESS
10μg/ml standard solution was scanned at two different flow rates i.e., at 0.7ml/min and 0.9ml/min

Figure 36: Chromatogram showing flow rate of 0.7ml/min
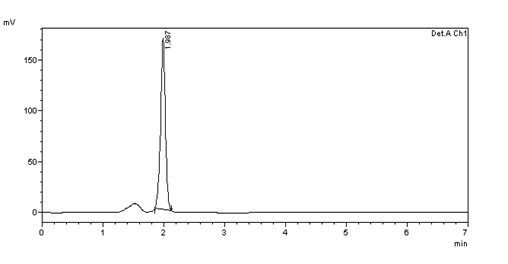
Figure 37: Chromatogram showing flow rate of 0.9ml/min
Table 8: Results of robustness
|
Parameter used for sample analysis |
Peak Area |
Retention Time |
Th.Plate |
|
Flow rate of 0.7 mL/min |
958357 |
1.990 |
3567 |
|
Flow rate of 0.9 mL/min |
926492 |
1.987 |
3480 |
|
Mean |
942424.5 |
|
|
|
Std. dev |
22531.96 |
|
|
|
%R.S.D |
0.2 |
|
|
Discussion: Results were found within the limits, acceptance criteria for % RSD < 2
L.O.D & L.O.Q
The limit of detection and limit of quantification was calculated by using the formula
LOD= 3.3 × σ / s
Where,
σ = Standard deviation of the response
S = Slope of the calibration curve
Result:
Bisoprolol fumarate:
=3.3 × 27180/82375
= 0.10µg/ml
LOQ=10×σ/S
Where,
σ = Standard deviation of the response
S = Slope of the calibration curve
Result:
Bisoprolol fumarate:
=10×27180/82375
= 0.32µg/ml
Table 9: Results of L.O.D and L.O.Q
|
PARAMETERS |
RESULTS |
|
Measured wavelength |
232nm |
|
Linearity range |
14-14µg/ml |
|
Slope |
82375 |
|
Intercept |
79968 |
|
Correlation coefficient |
0.999 |
|
L.O.D |
0.10µg/ml |
|
L.O.Q |
0.32µg/ml |
ASSAY (Standard):

Figure 38: Chromatogram of a standard solution of bisoprolol fumarate
Table 10: Peak results for assay standard
|
S.no |
Name |
Rt |
Area |
Height |
USP Tailing |
USP plate count |
|
1 |
Bisoprolol fumarate |
1.987 |
926879 |
2684.917 |
1.2 |
3589 |
ASSAY (Sample):

Figure 39: Chromatogram of sample solution of bisoprolol fumarate
Table 11: Peak results for assay sample
|
Sno |
Name |
Rt |
Area |
Height |
USP Tailing |
USP plate count |
|
2 |
Bisoprolol fumarate |
1.990 |
933597 |
187489 |
1.2 |
3597 |
Calculation:
%ASSAY =Sample areaStandard area×Weight of standardDilution of standard×Dilution of sampleWeight of sample×Purity100 ×Weight of the tablet Label claim×100==933597 /926879 × 10 / 1000×1 000 / 343.3 × 99.7 / 100 × 171 / 10 × 100 =100.72 %
The % purity of Bisoprolol fumarate in the pharmaceutical dosage form was found to be 100.72%.
CONCLUSION:
The analytical method was developed by studying different parameters. The maximum absorbance was found at 232 nm. The injection volume was selected to be 0.8 µl Which gave good peak area. The HPLC Colum used for the study was sunsil C18, which gave the best results. The mobile phase was a mixture of Acetonitrile: Water (60:40)v/v gave a good symmetrical peak. As no peak was interfering with the analyte peak, so it is specific. The percentage recovery was found to be 100.72% .both the method and system precision were found to be accurate within the limits. The method was found to be linear in the range of 4-14 µg/ml. The method was precise at intermediate precision and intraday precision. The results were found to be accurate at various levels like 50%, 100%, 150%. The method has cleared the L.O.D and L.O.Q which are within the limits. The analytical methods passed both ruggedness and robustness tests. In both cases, the relative standard deviation was well satisfied.
REFERENCES