International Journal of Pharmaceutical and Phytopharmacological Research
ISSN (Print): 2250-1029
ISSN (Online): 2249-6084


The proliferation of supplements alongside their widespread and acclaimed benefits is an important clinical and socio-economic issue. The study aimed at assessing the safety and efficacy of cannabidiol (CBD) oil in users based on the drug’s clinical impact on chronic health conditions. A follow-up questionnaire was developed to relate telephone conversations with participants to EQ-5D and EQ-VAS instruments’ relevant data biweekly. Patients were divided into 9 groups (hypertensive, diabetic, arthritis, inflammatory/pain, glaucoma, cancer, peptic ulcer disease, epilepsy, and asthma) based on their previously diagnosed clinical conditions. Index scores were calculated with a follow-up period of 8 weeks. A total of 157 participants across southern Nigeria states were recruited for the study. The response rate was 75.8% with 119 participants (49, 41.2 % male and 70, 58.8 % females). The medical classifications of participants in the study were cardiology (13, 11%), endocrinology (16, 13%), gastroenterology (15, 13%), oncology (8, 7%), psychiatry (13, 11%), ophthalmology (9, 8%) and others (48, 40%). The hypertensive and diabetes groups revealed improved QoL based on the statistically significant higher EQ-5D indices relating to clinical manifestations over the follow-up periods compared with the baseline features. Other groups similarly presented statistically improved health-related QoL. The study revealed the safety and efficacy of CBD in the various groups studied.
INTRODUCTION
Quite a vast number of active ingredients are in wide circulation today marketed and recommended as supplements with claims of health benefits in improving the quality-of-life (QoL) of users [1-4]. There are conflicting views among clinicians as to the safety and efficacy of these products. There is limited documented assessment of the claims on these products though there is a perceived wide usage [5, 6]. Regulatory authorities in the United States and Africa, in particular Nigeria, emboss on approve products a statement of non-liability concerning the usage of these products [7].
Many supplements contain one or more active ingredients with strong biological effects on the body. Their careful use and prescribing is, therefore, necessary as it appears that in certain climes, caution is thrown to the winds. One of the aims of using supplements is to allow patients to live better or longer with expected treatment outcomes revealing perceptible patient-reported improvement based on overall survival and or health-related quality QoL. EQ-5D, as an instrument, was introduced by the EuroQoL group in 2009 to improve the instrument’s sensitivity and reduce ceiling effect, as was evidenced in EQ-5D-3L. The entire instrument features the EQ-5D descriptive aspect and the EQ-visual analogue scale (EQ-VAS). Health-related QOL predicts a patient’s day-to-day activities and is regarded as the patient’s subjective perception of his physical, psychological, social functioning, and general well-being [8-10]. The establishment of a trial endpoint for supplements based on their purported use and claims should reveal clinically meaningful improvements in patients' QOL. The inclusion of alternative endpoints such as progression-free survival, disease-free survival, and the objective response rate will help identify their benefits [11, 12].
Extract from the cannabis plant has been in use medically for centuries without undergoing approved trials, until recently. National Drug Authorities recognize cannabis as a schedule 1 drug with the associated restrictions due to its potentials for abuse. This also explains the slow research pace on phytocannabinoids. CB is one of the over 120 naturally occurring phytocannabinoids found in Cannabis sativa L [13, 14]. Various CBD formulations have been evaluated in pre-clinical studies showing diverse medicinal properties including anti-nausea, anti-emetic, anti-tumor, anti-inflammatory, anti-depressant, anti-psychotic, and anti-anxiolytic [15-17]. In the market today there are different formulations of CBD employed for medicinal purposes. These formulations contain CBD with a variable amount of tetrahydrocannabinol (THC), the principal constituent, that have been unduly reported which provokes the psychoactivity and related side effects [18].
With the increasing acceptance of CBD products everywhere in the world, the collection of data around the medicinal benefits and potential side effects is necessary. This study aimed at assessing the safety and clinical effectiveness of CBD formulation based on the users’ QoL assessments.
MATERIALS AND METHODS
Study design
A correlational and cross-sectional assessment of drug safety and efficacy/clinical impact of CBD oil on patients with selected chronic cases were performed. A semi-structured interview method was employed to gather primary data on QoL from the participants in the selected states from a telephone-based conversation and immediately transcribed to complete an EQ-5D and EQ-VAS survey. All the states in the southern part of Nigeria were included in the study. Within a week of recruitment, a phone call was designed to be made to the participants and the logistics of reporting (time to call for follow-up on each assigned day) was established for each participant. The participants were to be followed up by 6 research assistants trained on the protocols of the study.
Sampling method
Participants were introduced to the study by members of the healthcare who have heard about claims on the benefits of CBD oil. A convenience sampling size for participants was employed. From April 2017 to December 2017, all enlisted persons were recruited and allowed to participate after duly filling the study informed consent form. Sampling was based on the available patients within the age included for the study.
Inclusion criteria
The inclusion criteria are related to outpatients with demographic characteristics of ≥ 10 years and ≤ 70 years of male or female gender and a present disease with measurable clinical characteristics.
Exclusion criteria
Participants were excluded if they had co-morbidities that could bias the results or any acute or chronic conditions that could limit their abilities to participate in the study.
Data collection
Data was collected at specific points in time, precisely at the start of use of supplement/drug, and every 2 weeks through the study up till 8 weeks. A questionnaire featuring a short survey was validated and read to participants through phone calls, due to off-site administration, at every data collection point and subsequently transcribed to a hardcopy that was previously developed to record findings.
Ethical approval
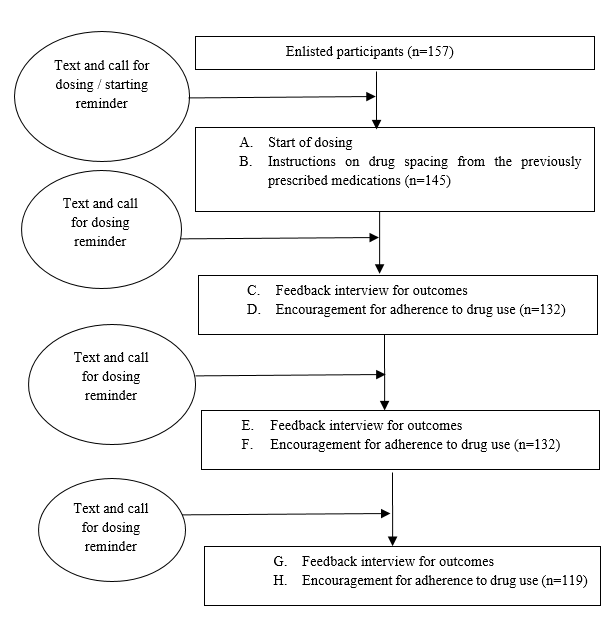
The protocols of the study were submitted to the Departmental Ethical Committee on Research of Clinical Pharmacy and Biopharmacy, University of Uyo, Nigeria with approval number CPB 2017/22. The flow chart for the study is indicated in Figure 1.
|
|
|
*Dropouts as a result of no answer to phone calls after 3 consecutive telephone calls, or direct indication of no longer willing to participate. The final study population was n=119. Figure 1. Study Flow Chart |
Statistical analyses
The study groups’ data was evaluated considering the EQ-5D index and the EQ-VAS measured comparing the baseline, middle of study (4 weeks), and end of study (8 weeks) assessments. Data was analyzed using SPSS version 20 (IBM, USA). The mean, standard deviation, and median were calculated for the teaching group’s outcome (EQ-5D index) for the baseline assessment, mid-study, and at the end of the study. Unpaired t-test was used to compare the means of indices at the different stages of the study and confidence interval set at 95%.
RESULTS AND DISCUSSION
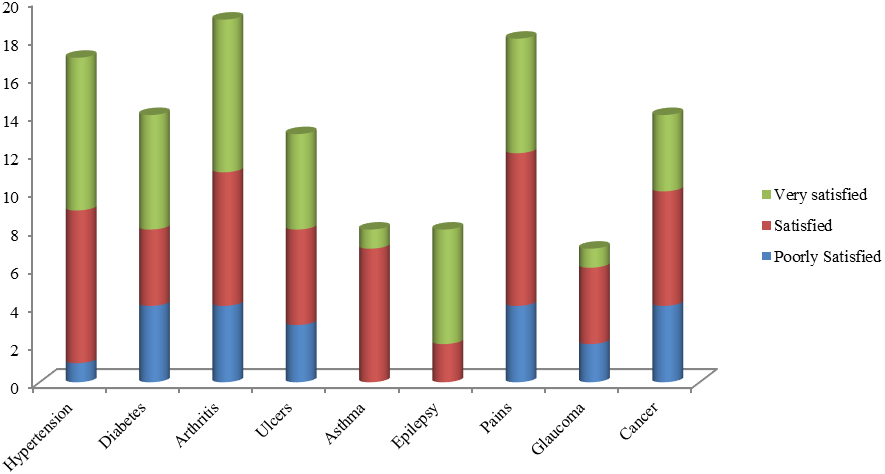
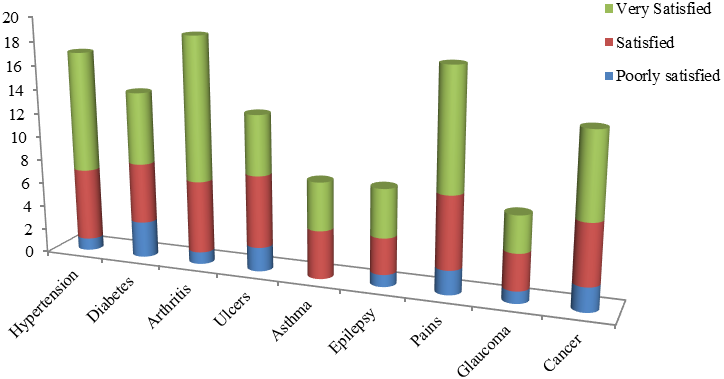
For this study, the total number of identified, recruited and enlisted participants were 157. The response rate for the study was 75.8%. Table 1 presents the details of the participants in the study concerning some of their socio-demographic characteristics. Table 2 highlights the descriptive EQ-5D assessment at baseline of study. The result emanating from EQ-5D measurement at end of study is reported in Table 3. Figure 2 and Figure 3 present the EQ-VAS indices of the respondents at 4 weeks and 8 weeks, respectively. The overall outcome of the EQ-5D measurements is presented in Table 4.
Table 1. Study Population Characteristics
|
Parameter |
Total N=116 |
Grp 1 (n=17)*a |
Grp 2 (n=13) |
Grp 3 (n=19) |
Grp 4 (n=13) |
Grp 5 (n=8) |
Grp 6 (n=8) |
Grp 7 (n=17) |
Grp 8 (n=7) |
Grp 9 (n=14) |
|
Age(mean) |
39.7±21.8 |
44.2±14.6 |
54.8±9.9 |
56.3±11.4 |
49.0±15.3 |
38.7±17.2 |
29.8±21.2 |
38.3±15.2 |
59.3±13.6 |
52±12.8 |
|
Sex Male (%) |
50 (45.5 ) |
6 (35.3 ) |
5 (38.5 ) |
6 (31.6) |
5 (38.5) |
5 (62.5) |
7 (87.5) |
5 (29.4) |
3 (42.9) |
8 (57.1) |
|
Female (%) |
66 (54.5 ) |
11 (64.7) |
8 (61.5) |
13 (68.4) |
8 (61.5) |
3 (37.5) |
1 (12.5) |
12 (70.6) |
4 (57.1) |
6 (42.9) |
|
Education Informal(%) |
20 (17.2) |
2 (11.8) |
3 (23.1) |
2 (10.5) |
2 (15) |
1 (12.5) |
3 (37.5) |
4 (23.5) |
1 (14.3) |
2 (14.3) |
|
Primary (%) |
33 (28.4) |
5 (29.4) |
0 (0) |
5 (26.3) |
6 (46.2) |
4 (50.0) |
1 (12.5) |
8 (47.1) |
1 (14.3) |
3 (21.4) |
|
Secondary (%) |
30(25.9) |
3 (17.6) |
7 (53.9) |
7 (36.8) |
3 (23.1) |
2 (25.0) |
2 (25.0) |
3 (17.6) |
3 (42.9) |
5 (35.7) |
|
Tertiary (%) |
20(17.2) |
6 (35.3) |
3 (23.1) |
5 (26.3) |
2 (15.4) |
1 (12.5) |
2 (25.0) |
1 (5.8) |
2 (28.6) |
3 (21.4) |
|
Postgraduate (%) |
3(2.6) |
1 (5.9) |
0 (0) |
0 (0) |
0 (0) |
0 (0) |
0 (0) |
1 (5.8) |
0 (0) |
1 (7.1) |
The values are presented as mean (±SD) or percentage. Group 1= hypertension. Group 2=diabetes; Group 3=arthritis; Group 4=ulcer; Group 5= asthma; Group 6=epilepsy; Group 7=pains/ inflammatory conditions; Group 8= glaucoma; Group 9= cancer. Percentages calculated for each group relates to the number of participants in each group
*a =percentage calculated based on n value of each group
|
|
|
Figure 2. Level of Satisfaction of Users of CBD after 4 Weeks of Initiation and Follow-up |
Table 2. The Descriptive EQ-5D Assessment at Baseline of Study
|
|
Grp 1 (n=17) |
Grp 2 (n=13) |
Grp 3 (n=19) |
Grp 4 (n=13) |
Grp 5 (n=8) |
Grp 6 (n=8) |
Grp 7 (n=17) |
Grp 8 (n=7) |
Grp 9 (n=14) |
|
Mobility |
|
|
|
|
|
|
|
|
|
|
No problems (%) |
12(70.6) |
7(53.8) |
2(10.5) |
7(53.8) |
8(100) |
7(87.5) |
2(11.8) |
5(71.4) |
7(50.0) |
|
Some problems (%) |
4 (23.5) |
5(38.5) |
9(43.4) |
6(46.2) |
0(0) |
1(12.5) |
11(64.7) |
2(28.6) |
5(35.7) |
|
Confined to bed |
1 (5.9) |
1(7.7) |
8(42.1) |
0(0) |
0(0) |
0(0) |
4(23.5) |
0(0) |
2(14.3) |
|
Self-care |
|
|
|
|
|
|
|
|
|
|
No problems (%) |
5(29.4) |
2(15.4) |
5(26.3) |
8(61.5) |
6(75.0) |
1(12.5) |
3(17.6) |
2(28.6) |
3 (21.4) |
|
Some problems (%) |
5(29.4) |
9(69.2) |
8(42.1) |
4(30.8) |
1(12.5) |
6(75.0) |
8(47.1) |
4(57.1) |
8(57.1) |
|
Unable (%) |
7(41.2) |
2(15.4) |
6(31.6) |
1(7.7) |
1(12.5) |
1(12.5) |
6(35.3) |
1(14.3) |
3(21.4) |
|
Usual activities |
|
|
|
|
|
|
|
|
|
|
No problem (%) |
2(11.8) |
4(30.8) |
2(10.5) |
1(7.7) |
3(37.5) |
0(0) |
3(17.6) |
2(28.6) |
2(14.3) |
|
Some problems (%) |
8(47.0) |
6(46.2) |
8(42.1) |
9(69.2) |
2(25.0) |
3(37.5) |
6(35.3) |
3(42.9) |
3(21.4) |
|
Unable (%) |
7(41.2) |
3(23.0) |
3(15.8) |
3(23.1) |
3(37.5) |
5(62.5) |
8(47.1) |
2(28.6) |
9(64.3) |
|
Pain/Discomfort |
|
|
|
|
|
|
|
|
|
|
No pains |
7(41.2) |
9(69.2) |
4(21.0) |
0(0) |
5(62.5) |
1(12.5) |
1(5.9) |
2(28.6) |
3(21.4) |
|
Moderate pains |
7(41.2) |
3(23.0) |
8(42.1) |
7(53.8) |
2(25.0) |
5(62.5) |
7(41.2) |
4(57.1) |
7(50.0) |
|
Extreme |
3(17.7) |
1(7.7) |
7(36.9) |
6(46.2) |
1(12.5) |
2(25.0) |
9(52.9) |
1(14.3) |
4(28.6) |
|
Anxiety/depression |
|
|
|
|
|
|
|
|
|
|
None |
2(11.8) |
3(23.0) |
0(0) |
7(53.8) |
2(25.0) |
1(12.5) |
6(35.3) |
4(57.1) |
0(0) |
|
Moderate |
5(29.4) |
7(54.0) |
12(63.2) |
6(46.2) |
3(37.5) |
3(37.5) |
7(41.2) |
3(42.9) |
5(35.7) |
|
Extreme |
10(58.9) |
3(23.0) |
7(36.8) |
0(0) |
3(37.5) |
4(50.0) |
4(23.5) |
0(0) |
9(64.3) |
Group 1= hypertension. Group 2=diabetes; Group 3=Arthritis; Group 4=Ulcer; Group 5= Asthma; Group 6=Epilepsy; Group 7=pains/ inflammatory conditions; Group 8= glaucoma; Group 9= Cancer. Percentages calculated for each group relate to the number of participants in each group. *a percentage calculated based on n value of each group
|
|
|
Figure 3. Overall Level of Satisfaction of Users of CBD at 8 Weeks of Initiation and Follow-up |
Table 3. The Descriptive EQ-5D Assessment at the End of Study
|
|
Grp 1 (n=17) |
Grp 2 (n=13) |
Grp 3 (n=19) |
Grp 4 (n=13) |
Grp 5 (n=8) |
Grp 6 (n=8) |
Grp 7 (n=17) |
Grp 8 (n=7) |
Grp 9 (n=14) |
|
Mobility |
|
|
|
|
|
|
|
|
|
|
No problems (%) |
11(64.7) |
11(81.6 ) |
11(57.9 ) |
11(84.6 ) |
7(87.5) |
5(62.5 ) |
10(58.8 ) |
6(85.7) |
8(57.1) |
|
Some problems (%) |
6(35.3) |
1(7.7) |
6(31.6) |
1(7.7) |
1(12.5) |
3(37.5 ) |
5(29.4) |
1(14.3 ) |
5(35.7) |
|
Confined to bed |
0(0) |
1(7.7) |
2(10.5) |
1(7.7) |
0(0) |
0(0) |
2(11.8) |
0(0) |
1(7.1) |
|
Self-care |
|
|
|
|
|
|
|
|
|
|
No problems (%) |
13(76.5) |
10(76.9) |
13(68.4) |
12(92.3) |
6(75.0 ) |
4(50.0) |
1376.5 ) |
6(85.7) |
6(42.9) |
|
Some problems (%) |
4(23.5) |
3(23.1) |
6(31.6) |
1(7.7) |
1(12.5) |
3(37.5) |
3(17.6) |
1(14.3) |
5(35.7) |
|
Unable (%) |
0(0) |
0(0) |
0(0) |
0(0 ) |
1(12.5) |
1(12.5) |
1(5.9) |
0(0) |
3(21.4) |
|
Usual activities |
|
|
|
|
|
|
|
|
|
|
No problem (%) |
14(62.4) |
12(92.3) |
14(73.7) |
12(92.3) |
5(62.5) |
4(50.0 ) |
12(70.6) |
7(100.0) |
8(57.1) |
|
Some problems (%) |
3(17.6) |
0(0) |
4(21.0 ) |
1(7.7 ) |
2(25.0) |
3(37.5) |
4(23.5) |
0(0) |
4(28.6) |
|
Unable (%) |
0(0) |
1(7.7) |
1(5.3 ) |
0(0) |
1(25.0) |
1(12.5 ) |
1(5.9) |
0(0) |
2(14.3) |
|
Pain/Discomfort |
|
|
|
|
|
|
|
|
|
|
No pains (% ) |
13(76.5) |
9(69.2) |
8(42.1) |
9(69.2) |
8(100.0 ) |
6(75.0 ) |
10(58.8) |
7(100.0) |
6(42.9) |
|
Moderate pains(% ) |
3(17.0) |
3(23.1) |
7(36.8) |
2(15.4) |
0(0) |
2(25.0 ) |
4(23.5) |
0(0) |
5(35.7) |
|
Extreme(% ) |
1(5.9) |
1(7.7) |
4(21.1) |
2(15.4) |
0(0) |
0(0) |
3(17.6) |
( 0) |
3(21.4) |
|
Anxiety/depression |
|
|
|
|
|
|
|
|
|
|
None(% ) |
15(88.2) |
8(61.5) |
14(73.7) |
8(61.5) |
5(62.5 ) |
6(75.0) |
15(88.2) |
6(85.7) |
5(35.7) |
|
Moderate(% ) |
2(11.8) |
3(23.1) |
3(15.8) |
3(23.1) |
2(25.0 ) |
2(25.0) |
2(11.8) |
2(14.3) |
6(42.9) |
|
Extreme(% ) |
0(0) |
2(15.4) |
2(10.5) |
2( 15.4) |
1(12.5) |
0(0) |
0(0) |
0(0) |
3(21.4) |
Group 1=hypertension. Group 2=diabetes; Group 3=arthritis; Group 4=ulcer; Group 5= asthma; Group 6=epilepsy; Group 7=pains/inflammatory conditions; Group 8=glaucoma; Group 9= cancer. Percentages calculated for each group relate to the number of participants in each group. *a percentage calculated based on n value of each group
Table 4. Use of CBD Oil and QoL Reports
|
EQ-5D index |
Groups in the Study |
||||||||
|
Grp 1 (n=17) |
Grp 2 (n=13) |
Grp 3 (n=19) |
Grp 4 (n=13) |
Grp 5 (n=8) |
Grp 6 (n=8) |
Grp 7 (n=17) |
Grp 8 (n=7) |
Grp 9 (n=14) |
|
|
(Start) |
|
|
|
|
|
|
|
|
|
|
Mean±SD |
0.23±0.06 |
0.17±0.03 |
0.47±0.02 |
0.32±0.09 |
0.38±0.04 |
0.54±0.10 |
0.32±0.03 |
0.33±0.09 |
0.19±0.05 |
|
Median |
0.29 |
0.17 |
0.53 |
0.35 |
0.45 |
0.62 |
0.33 |
0.31 |
0.12 |
|
Mid study |
|
|
|
|
|
|
|
|
|
|
Mean±SD |
0.69±0.02 |
0.57±0.14 |
0.68±0.02 |
0.56±0.13 |
0.59±0.15 |
0.78±0.11 |
0.52±0.09 |
0.49±0.16 |
0.36±0.02 |
|
Median |
0.72 |
0.61 |
0.71 |
0.59 |
0.67 |
0.79 |
0.53 |
0.43 |
0.32 |
|
(End of study) |
|
|
|
|
|
|
|
|
|
|
Mean±SD |
0.79±0.02 |
0.68±0.07 |
0.75±0.05 |
0.68±0.09 |
0.83±0.08 |
0.83±0.08 |
0.69±0.02 |
0.65±0.08 |
0.58±0.09 |
|
Median |
0.81 |
0.69 |
0.76 |
0.71 |
0.87 |
0.86 |
0.62 |
0.65 |
0.61 |
Group 1= hypertension. Group 2=Diabetes; Group 3=arthritis; Group 4=ulcer; Group 5= asthma; Group 6=epilepsy; Group 7=pains/ inflammatory conditions; Group 8= glaucoma; Group 9= cancer. Participants who dropped out and thus did not complete the study had their records sorted out and were deleted from the statistical analysis. Two-tailed P values are indicated for the unpaired t-test determinations at a 95% confidence interval
The participants in this QoL study have ailments that spread across the commonly observed medical categories ranging from chronic inflammatory/pain conditions, arthritis, neurological disorders, and psychiatric presentations. In this study, patients with co-morbidities were not admitted to participate. This forms the reason a larger number of participants than employed in this study was not possible as most interested persons presented with co-morbid conditions. This design was in view to ascertain, in clear terms, the effect of CBD in each group of peculiar/specific pathologies. Where there are co-morbidities, the effect of CBD may however be influenced by co-morbid disease factors, and resolving the overlap may require some complex protocols.
As in ideal conditions, the spaced-out co-administration of CBD oil with participants’ previous medications was emphasized in this study. This dosing condition was to prevent any unanticipated drug-drug interactions. In this singular design, the degree of the beneficial effect of CBD oil under a “real-life” clinical setting was explored as an effective/pragmatic trial [19, 20].
Drug efficacy studies such as this, usually demonstrate the health benefits of a drug over placebo or other intervention(s) when tested in an ideal situation. The design of the study focuses primarily on the health-related QoL characteristics as a parameter for adjudication. The efficacy of CBD oil as an adjunct to treatment in chronic and sub-chronic cases considered in this study had outcomes with statistical significance on comparing with baseline measurements. The non-parametric statistics of the QoL tool EQ-5D indices demonstrated the efficacy of CBD oil, as an intervention, as it produced a favorable result in the users
Some guidelines state that the QoL is a relevant endpoint for determining the relative effectiveness of new drugs [14, 21]. CBD oil was so regarded and thus experimented in these observed medical cases. The statistical associations for evaluated parameters have been observed from the consistent intake of CBD oil and the patient’s reported satisfaction. It is remarkable that at the level of two weeks of dosing, a large proportion of participants in each group reported their satisfaction in the use of CBD oil. On the performed regular calls and follow-up, no one of the participants had adjusted their doses of CBD oil and all had complied with their afore-prescribed medications.
Evaluating the symptoms and other clinical characteristics associated with each group was the core protocol for this exercise. Though there are guidelines for the treatment of these diseases highlighted in the groups studied, the issue of a patient’s QoL assessed by the EQ-5D index can be a vital tool in measuring achieved prognosis/success. The variance in the QoL measurements observed among members in a group in this study may have emanated from the lack of control on participants (due to the virtual participatory design), concentration difficulties, or cognitive factors. Similarly, affective components (e.g., depressed or anxious mood may affect reports as participants are expected to give a reliable assessment of their cognitive and affective symptoms.
EQ-VAS showed a significant difference comparing the post-start stages (2, 4, 6, and 8 weeks) with the baseline measurements for all the groups. In groups 3 (arthritis) and 7 (inflammation/pains), there were significantly higher EQ-5D indices progressively along the course of drug use. Mechanisms of cannabinoid analgesia have been postulated as early as 1964 [22-24]. Stemming from the primary research, synthetic cannabinoids such as ajulemic acid are in development.
Furthermore, there was a significant difference in the post-start indices of measurement indicating a better QoL for asthma and epilepsy groups (i.e., groups 5 and 6, respectively). In asthma, scientists have attributed the anti-inflammatory properties of CBD to its interaction with the endocannabinoid receptor CB2, which helps to reduce the level of pro-inflammatory cells such as C fibers or mast cells [25, 26]. In the same vein, the anti-seizure properties of CBD have been postulated to be mediated by a multitude of mechanisms that include the agonist and antagonist effects on ion channels, neurotransmitter transporters, and multiple 7-transmembrane receptors [27, 28].
The glaucoma group had significantly higher indices of measurement at 4 weeks compared with the baseline values. According to Tomida and co-workers, cannabinoids were reported to have neuroprotective properties and effectively reduce intraocular pressure [29, 30]. The limitation to the use of CBD in this regard may however be the development of tolerance with repeated use.
The cancer group had a strikingly significant difference in indices from week 2 of the use of CBD. The confessed progression of outcome was revealed by the values of EQ-5D for subsequent measurements. Literature has it that cannabis was used for cancer patients as early as 2500 years back. Preclinical studies, in recent times, including several animal models of tumors unanimously suggest the therapeutic efficacy of CBD [31].
Consumption of a wide array of supplements in the African continent for substantive improvement in the QoL of consumers will need to be evaluated following this approach. The use of the right QoL measurement for different clinical conditions may however be required for different cases.
The strength of this study, therefore, resides in the direct transposition of the effect of CBD in different age groups with a clearly defined uncomplicated medical condition. The benefit of CBD in individuals, and as a drug of benefit in the health system for majorly encountered chronic diseases, is highlighted.
CONCLUSION
The safe and efficacious use of CBD oil as a supplement for chronic health conditions is emphasized by this study. It is therefore recommended as an adjunct to therapy in the cases of these commonly encountered chronic ailments.
Acknowledgments: The authors wish to thank the staff of Bioscientifics Research and Development (Ltd/Gte) who helped in sorting and collating the data received on account of this work.
Conflict of interest: None
Financial support: None
Ethics statement: The study was performed in accordance with the approved guidelines of the Departmental Ethical Committee on Research of Clinical Pharmacy and Biopharmacy, University of Uyo, Nigeria.