International Journal of Pharmaceutical and Phytopharmacological Research
ISSN (Print): 2250-1029
ISSN (Online): 2249-6084

Full factorial (23) design was applied to evaluate the effects of addition of calcium chloride, magnesium chloride, and time of magnetic stirring on quality parameters of milk in the preparation process of calcium- and magnesium-enriched milk. The quality of the mineral enriched milk was evaluated in terms of relative density, dry matter, titratable acidity, the content of proteins, lipids, and carbohydrates as well as the content of calcium, magnesium, and phosphorus, and calcium: phosphorus ratio. In parallel, sensorial properties were analyzed to select the most preferable sample for consumers. The results from the experimental design and the sensorial analysis indicated that the application of medium levels of calcium and magnesium salts for milk enrichment provides acceptable quality and sensory characteristics similar to commercial milk. The determined content of calcium and magnesium in these samples was sufficient to give an additional 9.0% of the recommended daily allowance (RDA) for calcium (700 mg/day) and 2.6% of the RDA for magnesium (300 mg/day). Enrichment with calcium more than 0.3 g/100 g was inadequate in respect to certain quality parameters, and also off-flavors were developed during the first five days of the cold storage. The PCA was efficient in identifying and measuring the attributes of functional milk important for consumer acceptability. This study constitutes a step forward in developing strategies for the preparation of functional milk with increased nutritional value and favorable sensory profile that can be used as a vehicle for delivering more minerals to the human body.
INTRODUCTION
The newest trends in the food industry show that functional foods are extremely popular around the world, thus they are becoming part of our daily diet [1-3]. Mineral fortified/enriched foods are an important issue of this food category as they can prevent cation deficiencies in humans.
Among the delivery systems for mineral enrichment/fortification, cow’s milk and milk-based products have proven to be highly suitable because they are inexpensive, consumed by all groups at risk of deficiency, their high nutritional value, the buffering effect on digestion and absorption processes, and the positive effects on growth [4-6]. They provide the most concentrated sources of calcium in the diet, so public health organizations recommend that all individuals-including those that are lactose intolerant consume three servings of dairy per day to ensure adequate nutrient intake and optimal bone health. At the same time, the increase of the number of minerals as important micronutrients in milk could improve overall dietary balance and health of the malnourished as well as healthy individuals [7, 8]. The preparation of mineral enriched milk is a demanding multistage process influenced by various factors, such as the mineral source, its concentration, its properties, and the potential effects on the Physico-chemical characteristics on the food chosen as a vehicle. This process could improve the functional, technological as well as nutritional properties of the milk, but special emphasis must be given to the number of minerals added as they can cause several technological and even more importantly adverse effects on human health [9, 10]. In nutritional terms, such effects can lead to decreased bioavailability of the added active ingredient or vary the optimal conditions for its absorption whereas, in terms of quality, the sensorial characteristics of the final product may be altered, modifying the consumer response [11, 12].
The most important step is the determination of the optimal combination of ingredients/compounds and the quantity to be applied to obtain suitable Physico-chemical, rheological or sensory properties of the final product. The variations of the examined factors could be studied with a minimum number of experiments at the same time reducing time and costs of testing, using mathematical-statistical tools such as the design of experiments (DoE) [13, 14].
Improving the nutritional quality of milk is of concern to current producers, the dairy industry, and consumers [15]. A few studies have been conducted for the preparation of calcium-enriched milk [9, 16], however, according to the author's knowledge, studies dealing with the preparation of calcium- and magnesium-enriched milk are scarce in the literature. Since calcium is regularly available in milk products, the addition of magnesium may complete the daily intake of these important minerals [17-19]. Therefore, the present study aimed at the preparation of calcium- and magnesium-enriched milk that offers the potential for delivering more calcium and magnesium to the consumer. Design of experiments (DoE) was used for estimation of the most adequate levels of calcium and magnesium that would provide an additional intake of these minerals without affecting the overall quality of the milk. To study relationships among the various sensory properties of calcium- and magnesium-enriched milk and allow the grouping of the samples with similar characteristics, principal component analysis (PCA) was conducted. PCA may be used to extract important data and to obtain a small set of factors that show the maximum variability among samples at the same time reducing a large number of dimensions, each of them representing a linear combination of the original quality attributes [20, 21].
MATERIALS AND METHODS
Materials
Commercially available cow’s milk (3.5% fat, Alpsko, Slovenia) was used as a medium for mineral enrichment as well a control sample was purchased from the local markets. CaCl2 x 2 H2O and MgCl2 x 6 H2O, salts for milk enrichment, were supplied by Alkaloid (Skopje, North Macedonia). Stock standard solutions of Ca (1000 mg/L) and Mg (1000 mg/L), as well as lanthanum (III) oxide, were supplied from Merck (Darmstadt, Germany). The Bradford reagent and bovine serum albumin were supplied by Sigma-Aldrich (Co., St. Luis, USA) whereas ammonium molybdate was provided by Acros Organics (Geel, Belgium). All reagents were of analytical grade. High purity water was used in all the analyses to prepare standards and samples.
Design of experiments (DoE) and preparation of mineral-enriched milk batches
Design of experiments (DoE) was used for the optimization of quality parameters of mineral enriched milk batches. 23 full factorial design involving a set of 11 planned experiments was applied and the influence of three experimental factors (independent variables) was investigated: calcium chloride concentration (x1) in the range 0.1-0.5 g/100g, magnesium chloride concentration (x2) in the range 0.02-0.1 g/100g and time of magnetic stirring (x3) in the range 10-30 min (Table 1). This type of design defines two levels for the independent variables, upper (“+”), lower (“–“) level, and a zero level (center), in which all variables are fixed at their mean value, to minimize the risk of missing non-linear relationships. The MODDE 10.0 software (Umetrics, Umea, Sweden) was used.
Table 1. Investigated experimental variables and their respective ranges
|
|
Variables |
Experimental values |
|
|
|
(-) (+) (0) |
|
X1 |
CaCl2 (g/100 g) |
0.10 0.50 0.30 |
|
X2 |
MgCl2 (g/100 g) |
0.02 0.10 0.06 |
|
X3 |
Magnetic stirring (min) |
10 30 20 |
An accurately weighed amount of calcium chloride and magnesium chloride salts, as defined by the design, was added to the Erlenmeyer flask containing 100 g commercially available milk. This amount of calcium and magnesium represents an additional supply to the recommended daily allowance for calcium (3.9, 19.4, and 11.7%) and for magnesium (0.8, 4.0, and 2.4%) respective to lower, upper limit, and a zero level [22, 23].
The overall quality of the enriched batches was evaluated by analysis of the Physico-chemical (dependent) variables: titratable acidity, dry matter, relative density, protein, fat, and total carbohydrate content, calcium, magnesium, and phosphorus content as well as calcium: phosphorus ratio. For each dependent variable, response surface plots were generated. To set the optimal values for the quality of mineral enriched batches, the data from the physicochemical analysis of control milk were used as reference (Tables 2 and 3).
Sample preparation for mineral content determination
The control milk, as well as the enriched milk samples, were mineralized by dry ashing. 2 g of sample were measured in a porcelain crucible and dried on a hot plate. After charring, samples were put in the muffle furnace and the temperature was gradually increased by 50 °C h-1 up to 550 °C and maintained at this temperature for 24 h. Where necessary, the ash was bleached with 30% H2O2. Ashed samples were quantitatively transferred to a suitable volumetric flask and dissolved up to 50 mL with 10% HCl. The solutions were further used for calcium, magnesium, and phosphorus determination.
Physicochemical analysis
Physicochemical analysis was performed immediately after the preparation of the enriched samples. Calcium and magnesium content was determined by flame atomic absorption spectrometry (Shimadzu AA-7000, Japan), in an air-acetylene flame. Depending on the element measured, the dissolved ashed samples for mineral determination were appropriately diluted and an aliquot of lanthanum trichloride solution was added to minimize interferences from phosphates as well as to minimize ionization of elements [24]. The wavelength for Ca and Mg determination was 422.7 nm and 285.2 nm, respectively.
Phosphorus content was determined UV-spectrophotometrically (Lambda 16, Perkin Elmer, Norwalk, CT, USA) using a method proposed by Bezerra et al. (2011) [25], with modifications. 2 g of sample was digested on a water bath for one hour followed by addition of one drop ethanol and zinc oxide to stop foaming. Afterward, the samples were transferred to the muffle furnace, at the temperature of 450 °C. The ashed sample dissolved in 10% HCl was quantitatively transferred to a volumetric flask and diluted up to 50 mL with high purity water (sample solution). 2 mL of the sample solution and 4 mL of a solution containing ammonium molybdate and ascorbic acid were mixed in a 100 mL volumetric flask and diluted up to volume with water. The content was heated on a boiling water bath for 15 min until the blue color was developed. The absorbance of the sample solutions was determined at 823 nm and the result was expressed as mg P/100 g milk.
After the determination of calcium and phosphorus content, the ratio calcium: phosphorus was calculated since it indicates the calcium bioavailability from the enriched product [9].
Titratable acidity was determined by AOAC official methods of analysis, 2019 [26] and expressed as % of lactic acid. Prior determination of this parameter, samples were thoroughly mixed.
Dry matters were determined gravimetrically. Briefly, 5 g of each sample was transferred into a pre-weighed round flat-bottomed porcelain dish provided with a fitting lid. The dish, with the sample and lid, was heated at 103 ± 2 °C, cooled in a desiccator, and weighed until the difference between the two successive weightings did not exceed 1 mg. The results were expressed as grams of total solids per 100 g of sample.
Fats were quantified using graduated glass butyrometers for direct measurement of fat in dairy products according to the Gerber method [27].
Protein content was measured based on the method described by Bradford [28], using the Coomassie protein assay reagent and bovine serum albumin as a standard. Before protein quantification, the pH of the samples was adjusted to 3.8 using a 50% solution of lactic acid. Then, the samples were centrifuged (7200 rpm; 10 min) and the pH of the collected supernatants was readjusted to 7.0. Afterward, the samples were recentrifuged at 7200 rpm for 10 min and the protein concentration in the obtained supernatants was measured at 595 nm [29].
Quantitative analysis of total carbohydrates content was performed spectrophotometrically using the palladometric method under conditions optimized and described by Petrusevska-Tozi & Bauer Petrovska (1997) [30]. This method is based on the reduction of PdCl2 and oxidation of carbohydrates in a weak alkaline medium provided by dissolving the oxidizing agent in a mixture with sodium sulfite and potassium sodium tartrate.
Sensory analysis
Sensory analysis was performed by a non-trained panel of 12 judges, simulating the consumers, aged 25 to 62 years. The use of non-trained personnel was due to limitations in time and financial availability, allied to the interest of simulating the behavior of a common consumer [31]. Mineral-enriched milk samples were presented to the panelists with a random code to avoid associations to the product characteristics and were placed in plastic cups for evaluation. Deionized water was provided for rinsing in-between the samples. Since sensory analysis immediately after production of the enriched milk may not reflect actual sensory characteristics when compared to control milk, the samples were stored in the refrigerator for 5 days to allow milk components to interact with calcium and magnesium. The milk was served 30 min after removal from the refrigerator. The panelists were asked to use a 10-point scale to evaluate the taste, mouthfeel, flavor, color, and the overall acceptability of the samples (0-very unpleasant, 5-neither like nor dislike, 10-very pleasant).
Principal component analysis (PCA) of sensory characteristics of calcium- and magnesium-enriched milk was performed in the SIMCA 14.1 software (Umetrics, Umea, Sweden), to investigate the most important variables affecting overall product quality.
RESULTS AND DISCUSSION
Mineral enrichment of milk is a multistage process where the proper selection of salts is one of the critical steps leading to a successful design of a functional product. According to the literature data, when added to milk, calcium chloride shows high solubility and gives good mouthfeel and color characteristics of the product [9]. In this study, chloride salts of calcium and magnesium were used. When added in proper quantities, they show insignificant effects on the overall quality of milk. Although some authors raise concerns that additional intake of chloride ions may increase excretion of calcium from the bones if the intake does not exceed 2.4 g/day, adverse effects are minor [32].
Mineral content in calcium and magnesium-enriched milk
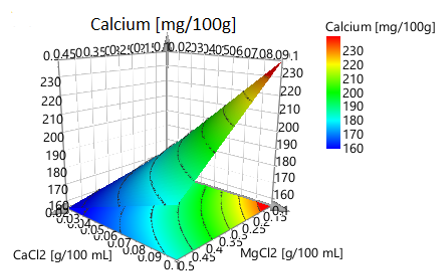
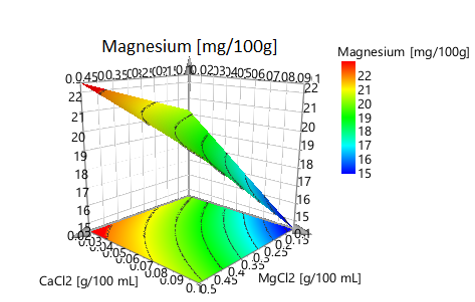
The results from the determined content of calcium, magnesium, phosphorus, and calcium: phosphorus ratio in the different mineral-enriched batches are shown in Table 2. As it can be seen, the obtained values in the samples account for 1.1-20.3% of the RDA for calcium (700 mg/day) and 0.3-4.0% of the RDA for magnesium (300 mg/day), respectively [22, 23]. The results from the response surface plot indicate that the expected supply for calcium and magnesium calculated in respect to their RDA can be provided when the added quantity of calcium salts ranges 0.176-0.5 g/100 g (Figure 1a) and the added quantity of magnesium salts ranges 0.02-0.09 g/100 g product (Figure 1b).
Table 2. Calcium, magnesium, and phosphorus content (mg/100 g) in mineral-enriched batches. The determined content for calcium and magnesium was expressed as % of RDI and the calcium: phosphorus ratio was calculated.
|
|
Ca content (mg/100 g) |
Additional % of RDA for Ca estimated |
Mg content (mg/100 g) |
Additional % of RDA for Mg estimated |
P content (mg/100 g) |
Ca:P ratio |
|
Control |
122.17±0.76 |
/ |
11.93±0.31 |
/ |
91±0.065 |
1.35 * |
|
Batch N0 |
|
|
|
|
|
|
|
1 |
127.95±0.04 |
1.14 |
16.38±0.23 |
1.46 |
79.45±0.18 |
1.61 |
|
2 |
149.38±0.63 |
4.20 |
21.90±0.13 |
3.30 |
104.83±0.18 |
1.42 |
|
3 |
261.88±0.38 |
20.27 |
15.77±0.08 |
1.26 |
112.72±0.19 |
2.32 |
|
4 |
154.70±0.40 |
4.96 |
15.66±0.10 |
1.22 |
102.14±0.10 |
1.51 |
|
5 |
226.42±0.29 |
15.20 |
23.82±0.08 |
3.94 |
78.23±0.02 |
2.89 |
|
6 |
172.55±0.25 |
7.51 |
22.64±0.13 |
3.55 |
105.49±0.15 |
1.64 |
|
7 |
226.79±0.27 |
15.26 |
12.82±0.12 |
0.27 |
194.65±0.06 |
1.17 |
|
8 |
221.75±0.24 |
14.54 |
24.24±0.14 |
4.08 |
52.15±0.15 |
4.25 |
|
9 |
185.63±0.35 |
9.37 |
20.50±0.25 |
2.83 |
94.82±0.15 |
1.96 |
|
10 |
182.43±0.39 |
8.92 |
18.72±0.15 |
2.24 |
97.43±0.20 |
1.87 |
|
11 |
180.63±0.35 |
8.66 |
20.30±0.20 |
2.77 |
93.83±0.18 |
1.92
|
*All data presented as mean ± SD
% RDA of calcium (700 mg/day) and magnesium (300 mg/day) as established by EFSA
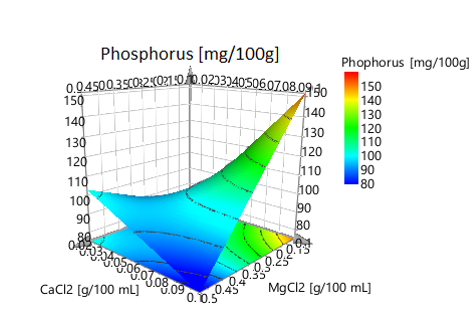
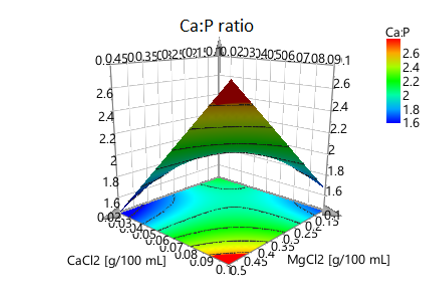
The phosphorus content in the mineral enriched batches varied in the range 52.15-194.65 mg/100 g and these variations could be a result of certain changes of mineral balance and increased calcium concentrations. The response surface plot (Figure 1c) implies that phosphorus content corresponding to calcium: phosphorus ratio in favor of calcium (60-130 mg/100 g) could be achieved when the amount of added calcium salts range 0.178-0.5 mg/100 g and the amount of added magnesium salts ranges 0.02-0.094 mg/100 g product. Further, the obtained results for calcium and phosphorus content were combined to calculate the calcium-phosphorus ratio as an indicator that represents the potential of calcium to be absorbed from a certain type of formulation or food. The response surface plot shown in Figure 1d shows that favorable calcium: phosphorus ratio was found for the whole tested range of calcium and magnesium amounts added. All of the prepared batches showed a favorable calcium-phosphorus ratio; the samples containing upper levels of calcium had several times the higher ratio in favor of calcium.
Titratable acidity of calcium- and magnesium-enriched milk
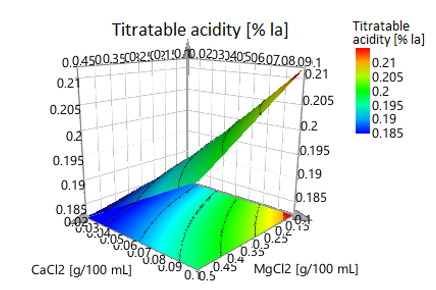
The titratable acidity of the examined mineral-enriched batches ranged from 0.16-0.22% of lactic acid (Table 3). According to the literature, the lowest reference value for titratable acidity of the enriched samples should be 0.13%, whereas the highest acceptable value should be 0.20% [33]. The generated response surface plot (Figure 2a) showed that this parameter was sensitive to the amounts of calcium and magnesium salts added. Values lower than 0.20% were obtained when calcium content ranged from 0.21 to 0.5 g/100 g and magnesium content ranged from 0.02 to 0.092 g/100 g. A significant increase in titratable acidity was found in all batches containing the upper level of added calcium regardless of the magnesium content as well as the time of magnetic steering. This occurrence had a negative influence on the sensorial characteristics of the functional product which was confirmed by the sensorial analysis. In the rest of the batches, the determined values for titratable acidity were in accordance with reference values for cow’s milk.
|
|
|
a) |
|
|
|
b) |
|
|
|
c) |
|
|
|
d) |
|
Figure 1. Three-dimensional response surface plots showing effects of an added quantity of calcium and magnesium salts on: a) calcium content, b) magnesium content, c) phosphorus content, and d) calcium: phosphorus ratio in mineral-enriched formulations |
Table 3. Experimental data on titratable acidity (% lactic acid), relative density, dry matter (%), carbohydrate content (g/100 g), protein content (g/100 g), and fat content (g/100 g) for the different mineral-enriched milk batches
|
|
Experimental data for Physico-chemical (quality) parameters* |
|||||
|
|
Titratable acidity (% lactic acid) |
Relative density |
Dry matter (%) |
Carbohydrate Content (g/100 g) |
Protein content (g/100 g) |
Fat content (g/100 g) |
|
Control |
0.14 |
1.034 |
12.10 |
4.70 |
3.40 |
1.50 |
|
Batch N˚ |
|
|
|
|
|
|
|
1 |
0.16 |
1.034 |
11.39 |
4.10 |
3.31 |
1.50 |
|
2 |
0.18 |
1.034 |
11.54 |
3.80 |
4.08 |
1.50 |
|
3 |
0.21 |
1.035 |
11.50 |
4.84 |
3.36 |
0.40 |
|
4 |
0.17 |
1.034 |
11.78 |
3.65 |
2.53 |
1.50 |
|
5 |
0.21 |
1.037 |
11.10 |
5.36 |
3.69 |
0.20 |
|
6 |
0.19 |
1.033 |
10.71 |
4.33 |
3.60 |
1.50 |
|
7 |
0.21 |
1.037 |
11.22 |
5.30 |
3.79 |
0.40 |
|
8 |
0.22 |
1.036 |
11.79 |
5.23 |
4.21 |
0.20 |
|
9 |
0.20 |
1.035 |
11.42 |
5.37 |
3.78 |
1.50 |
|
10 |
0.20 |
1.035 |
12.14 |
4.82 |
3.99 |
1.50 |
|
11 |
0.20 |
1.035 |
11.42 |
5.37 |
3.78 |
1.50 |
*Values are means of triplicate readings
|
|
|
a) |
|
|
|
b) |
|
|
|
c) |
|
|
|
d) |
|
|
|
e) |
|
|
|
f) |
|
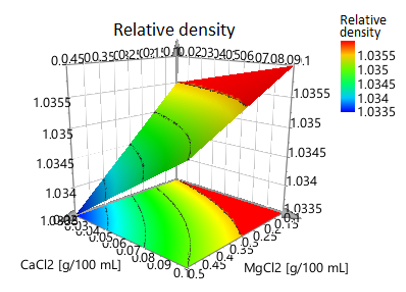
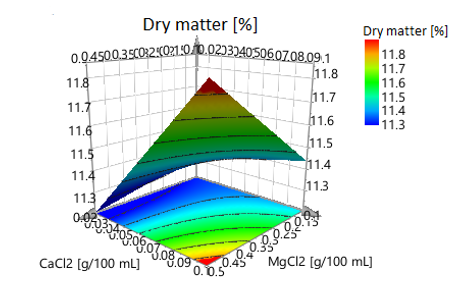
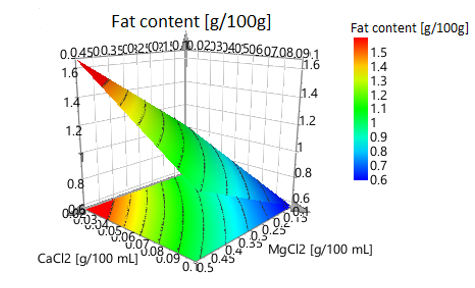
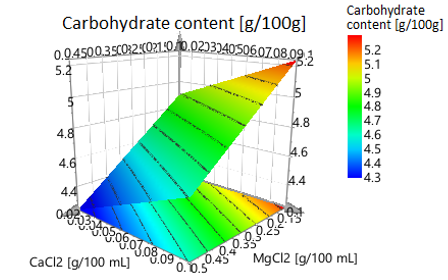
Figure 2. Three-dimensional response surface plots showing effects of added quantity of calcium and magnesium salts on: a) titratable acidity, b) relative density, c) dry matter and d) fat content e) protein content, and f) carbohydrate content in mineral-enriched formulations |
Relative density of calcium- and magnesium-enriched milk
The obtained results for relative density (Table 3) of mineral enriched milk batches imply that the increasing value is proportional to the amounts of minerals added. The relative density of all examined enriched batches was in the range from 1.033-1.037 which was in accordance with the criteria for mineral enriched milk [34]. The three-dimensional response surface plot (Figure 2b) shows that the amount of added calcium and magnesium has the most significant influence on relative density. As it can be seen from the three-dimensional plot, a relative density value less than 1.038 can be obtained within the range of 0.19-0.5 g/100 mL and 0.02-0.06 g/100 mL for calcium and magnesium, respectively.
Dry matter in calcium- and magnesium-enriched milk
The dry matter of the individual batches ranged from 10.71 – 12.14% which is in accordance with the quality criteria for cow’s milk (Table 3). The analysis of the response surface plot (Figure 2c) shows that the optimal value of dry matter content is comparable to dry matter of milk that corresponds to the entire tested range of added calcium and in the range 0.02 to 0.066 g/100 g of added magnesium.
Fat content in calcium- and magnesium-enriched milk
In the enriched milk samples, the obtained results for the fat content were in the range from 0.2 to 1.5 g/100 g. The response surface plot (Figure 2d) implies that optimal value for fat content in mineral-enriched batches which is closest to the value for fat content in cow’s milk is obtained when calcium is added in the concentration range 0.3-0.5 g/100 g and magnesium is added in the range 0.02-0.07 g/100 mL. The samples enriched with calcium amounts lower than 0.3 g/100 g and amounts of added magnesium higher than 0.07 g/100 g showed comparable quality to cow’s milk. Batches enriched with upper levels of calcium had reduced fat content (Table 3) which might be a result of the hypolipidemic activity of calcium probably due to binding to milk fats [35-39].
Protein content in calcium- and magnesium-enriched milk
The protein content in the enriched batches ranged from 2.5-4.5 g/100 g product (Table 3). The response surface plot shown in Figure 2e indicates that the most similar protein content to cow’s milk was achieved in the entire examined interval of added calcium and magnesium added in ranges 0.06-0.1 g/100 g. The variations in the protein content among the different batches might be a result of the ability of calcium ions to bind to the casein of milk, and under certain conditions stimulate precipitation [40]. As expected, samples with higher values of titratable acidity showed higher values for protein content. In this case, as in the previous cases, the calcium and magnesium added showed the highest influence on the protein content of the mineral-enriched batches.
Carbohydrate content in calcium- and magnesium-enriched milk
The carbohydrate content in the prepared mineral-enriched batches ranged from 3.65-5.37 g/100 g product. The reference value for carbohydrate content in cow’s milk ranges between 4.35-4.84 g/100 g. The response surface plots (Figure 2f) showed that optimal calcium amount to fulfill the requirements for carbohydrate content ranges from 0.281-0.5 g/100 g, whereas the optimal amount of magnesium was in the range 0.02-0.066 g/100 g. However, the batches enriched with upper levels of calcium salts added did not comply with the reference values for the carbohydrate content of the cow’s milk.
|
|
|
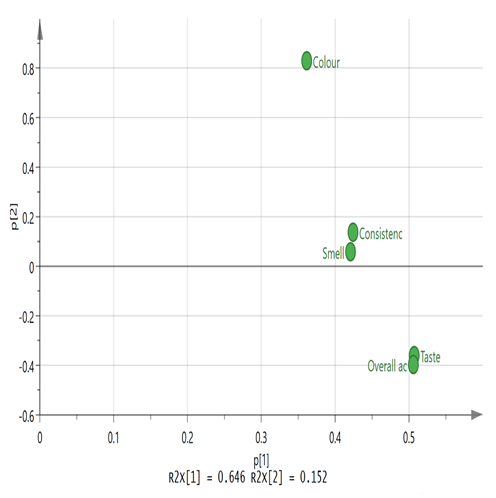
Figure 3. Loading plot of the PCA model showing sensory characteristics most influential to overall product acceptability |
Sensorial analysis
Sensory analysis of the mineral-enriched product(s) represents the ultimate method for the evaluation of products quality [41]. Also, the quality expressed by sensory attributes is an important indicator of the overall quality and health safety of milk. In this study, all samples were characterized by adequate appearance/color during the entire examination period. However, the panelists reported significant differences between the taste and consistency of the tested milk samples enriched with the highest level of calcium chloride regardless of the level of magnesium chloride as compared to control milk. These samples showed unacceptable taste and consistency even after one day of cold storage.
PCA presents the studies variables in a reduced dimensional space. The first principal component (PC1) and the further PCs are linear combinations of the original variables which preserve maximal variance of the data. The first two PCs contain most of the variance of the data whereas the other PCs are practically unimportant [42]. The PCA model of the analyzed sensory attributes of calcium and magnesium-enriched milk explained 99.5% of the variance in the data. The overall sensory quality could be described by the first two principal components, PC1 and PC2 which together explain 79.8% of data variability. Several significant correlations between the sensory attributes were found. The inspection of the loading plots (Figure 3) of the PCA model showed that the sensory attributes of smell and consistency are positioned close to each other and so are the factor taste and overall acceptability. This is in accordance with the literature finds which suggest that undesirable flavor(s)/off-flavor(s)/taste in fluid milk can negatively affect milk consumption and consumer product acceptability [43]. The color was positioned by the angle of 90° to the other examined sensory attributes indicating that it could not be correlated with the rest of the factors in the sensory analysis. The highest positive correlations were identified between taste and overall acceptability. Positive correlations were also found between smell and consistency and overall acceptability as well as between consistency and taste. The PCA analysis of sensory attributes of calcium and magnesium-enriched milk identified taste as the most influential factor for the overall acceptability.
CONCLUSION
The experimental design was successfully applied to define calcium and magnesium chloride amounts to prepare mineral-enriched milk with quality and sensory parameters comparable to cow’s milk. According to the design, the most adequate levels of calcium and magnesium salts that resulted in good physicochemical and sensory characteristics, excluded upper tested levels of calcium since the overall acceptability of the product was compromised. However, using experimental data, a batch of milk enriched with medium amounts of calcium and magnesium was prepared to provide an additional intake of these minerals at the same time showing potential to be offered to the consumers as a new functional product. The information obtained using this approach may be of great interest in designing new products with nutritional and sensory characteristics that meet consumer demands. In addition, to meet consumers' expectations, PCA could be efficiently used in identifying the important sensory attributes which influence a product`s plausibility.
Acknowledgments: Special thanks to Zoran Zivik and Kristna Shutevska, memebers of the Institute of Applied biochemistry for their help with the sensorial analysis.
Conflict of interest: None
Financial support: None
Ethics statement: None